
To read an air VPD chart, find the measured air-temperature row and relative-humidity column. Their intersection gives the air vapor-pressure deficit in kPa. That number describes a physical air condition; it does not, by itself, identify the best condition for every crop or stage.
Air VPD lookup table
All entries below are air VPD in kPa, calculated from the same saturation-pressure equation and rounded to two decimals. The table is a lookup aid, not a crop target map. It does not assume a leaf temperature. Use measurements taken at the same time and representative location.
| Air temperature (°C) | 40% RH | 50% RH | 60% RH | 70% RH | 80% RH | 90% RH |
|---|---|---|---|---|---|---|
| 16 | 1.09 | 0.91 | 0.73 | 0.55 | 0.36 | 0.18 |
| 18 | 1.24 | 1.03 | 0.83 | 0.62 | 0.41 | 0.21 |
| 20 | 1.40 | 1.17 | 0.94 | 0.70 | 0.47 | 0.23 |
| 22 | 1.59 | 1.32 | 1.06 | 0.79 | 0.53 | 0.26 |
| 24 | 1.79 | 1.49 | 1.19 | 0.90 | 0.60 | 0.30 |
| 26 | 2.02 | 1.68 | 1.34 | 1.01 | 0.67 | 0.34 |
| 28 | 2.27 | 1.89 | 1.51 | 1.13 | 0.76 | 0.38 |
| 30 | 2.55 | 2.12 | 1.70 | 1.27 | 0.85 | 0.42 |
| 32 | 2.85 | 2.38 | 1.90 | 1.43 | 0.95 | 0.48 |
At 24°C and 70% RH, read 0.90 kPa. At 30°C and 40% RH, read 2.55 kPa. These are hypothetical input conditions, not operating recommendations. For a value between rows or columns, use the formula below rather than assuming that interpolation is exact.
Calculate a value outside the grid
Using the saturation-pressure relationship in FAO Irrigation and Drainage Paper 56, Chapter 3, with T in °C and pressures in kPa:
- e_s(T) = 0.6108 × exp[17.27 × T / (T + 237.3)]
- e_a = (RH / 100) × e_s(T_air)
- Air VPD = e_s(T_air) − e_a
For the illustrative 24°C, 70% RH condition:
- e_s(24) = 2.9839 kPa.
- e_a = 0.70 × 2.9839 = 2.0887 kPa.
- Air VPD = 2.9839 − 2.0887 = 0.8952 kPa, displayed as 0.90 kPa.
For 30°C and 35% RH, the same calculation gives 2.7580 kPa, displayed as 2.76 kPa. Use RH as 35 divided by 100, not the number 35, in the formula. The table's 0.01 kPa display step is rounding resolution, not a statement of sensor accuracy.
Leaf VPD is a different calculation
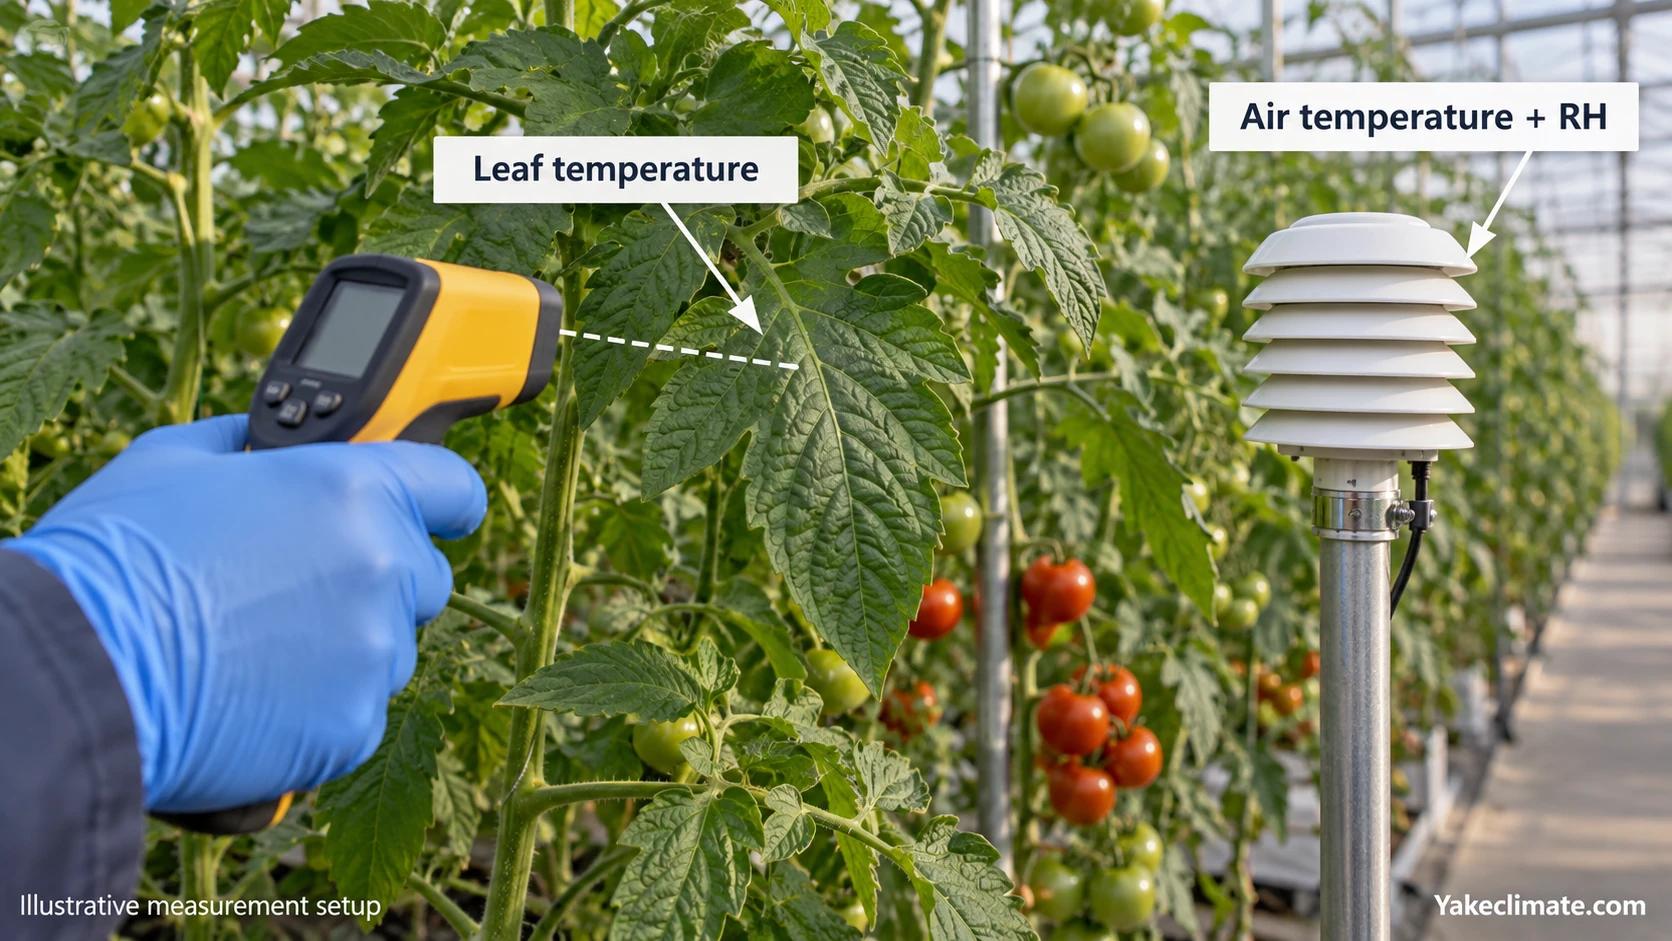
A leaf may be warmer or cooler than the air measurement. For the conventional approximation of saturated water vapor inside the leaf at measured leaf temperature:
Leaf-to-air VPD ≈ e_s(T_leaf) − e_a.
For the same hypothetical air at 24°C and 70% RH, let measured leaf temperature be 22°C. Then e_s(22) = 2.6439 kPa and the leaf-to-air difference is 2.6439 − 2.0887 = 0.5552 kPa, or 0.56 kPa. The air VPD remains 0.90 kPa. Replacing air temperature with leaf temperature everywhere would incorrectly change the measured air vapor pressure too.
Only when leaf and air temperatures are equal does this approximation equal air VPD. Do not assume a fixed leaf-temperature offset from the lamp type. Record how and where leaf temperature was measured, and compare representative leaves rather than one convenient surface.
If this calculated leaf-to-air difference is negative, the surrounding vapor pressure exceeds the saturation value at that leaf temperature. Investigate dew point, actual leaf temperature and measurement uncertainty as a possible condensation condition. The calculation alone does not establish that a leaf is visibly wet or diagnose a disease.
Use the chart in a crop-zone check
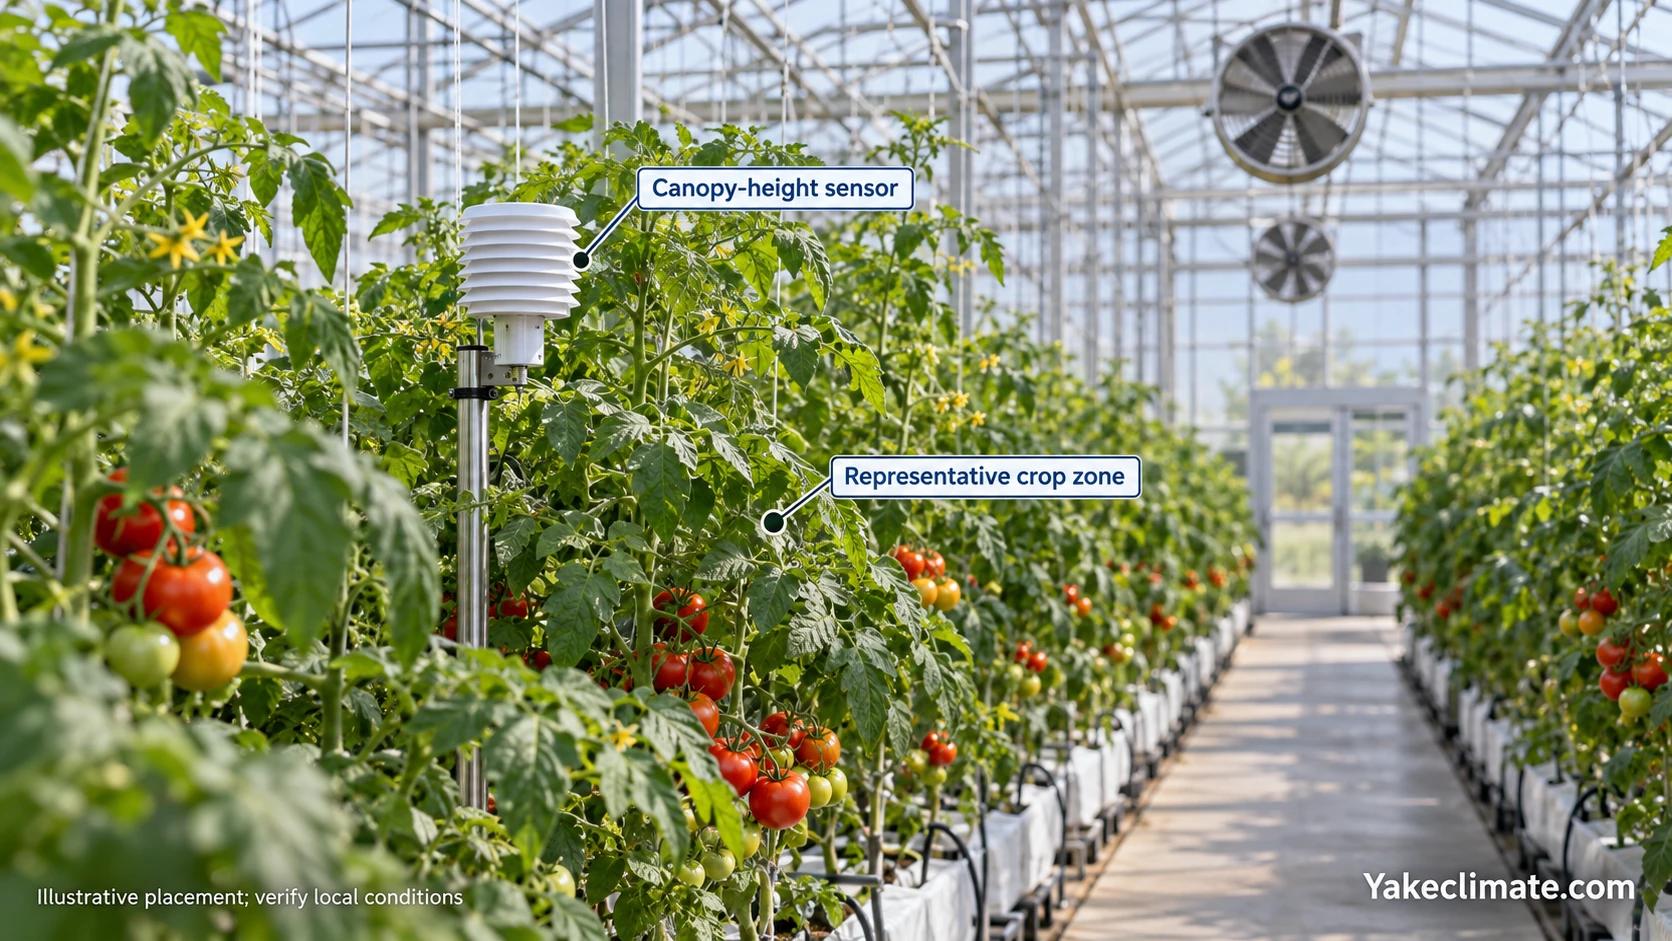
Start with the observation that needs explanation: a night-time rise in RH, a disagreement between locations, or a change after screens, lighting or ventilation moved. Record time, zone, air temperature and RH, the calculated air VPD and, where needed, separately measured leaf temperature. Include irrigation and equipment states on the same timeline.
Check the measurement before treating an unusual chart value as a crop response. A sensor near a discharge jet may describe that jet rather than the crop. A sun-warmed unshielded sensor may describe a different temperature from the intended air measurement. The greenhouse sensor-placement guide explains how to make the measurement location explicit.
Keep the record's measured values separate from the target supplied by the grower or crop specialist. Name the crop, cultivar, stage, light period and supporting protocol for that target. A generic colored “ideal zone” cannot supply those missing decisions.
Decide the response from the direction of the deviation
For a fixed air temperature, removing water lowers actual vapor pressure and increases air VPD. Therefore, a high-VPD reading is not a reason to automatically increase dehumidification. A low-VPD reading also needs context: examine temperature, the crop strategy, surface condensation risk and the available actions together.
Changing temperature changes the calculation as well as crop and equipment conditions. Do not correct a chart cell by adjusting one control in isolation. The automated greenhouse humidity-control guide provides the coordination framework for heating, ventilation and moisture removal.
After a controlled change, compare the same representative points under recorded operating conditions. Note what changed, whether the intended variable responded, and whether other limits were exceeded. A coincident improvement does not by itself identify the original cause. Keep the result as a site observation rather than a general yield or disease-prevention claim.
Common reading errors
| Error | Correction |
|---|---|
| Using RH without air temperature | Record the simultaneous temperature and use its row |
| Calling air VPD “leaf VPD” | Measure leaf temperature and keep e_a based on air measurements |
| Treating chart colors as universal crop targets | Obtain the crop- and stage-specific target separately |
| Averaging temperature and RH first for a changing period | Calculate each paired observation before summarizing the resulting series |
| Adding dehumidification whenever VPD is outside a band | Check the direction and the approved control strategy |
| Reporting rounded chart cells as precise measurements | Keep sensor uncertainty and location limitations with the result |
For the wider relationship between measurement, crop conditions and equipment, use the agriculture humidity-control overview.
FAQ
Frequently asked questions
What does a VPD chart actually tell me?
An air VPD chart converts paired air temperature and RH into a vapor-pressure difference. It does not measure leaf temperature, crop water use, equipment capacity or disease.
What is the best VPD for my crop?
Select the target from a relevant crop protocol or crop specialist with cultivar, stage and growing conditions defined. The physical lookup table is not a universal prescription.
Can I use air VPD as leaf VPD?
Only as an explicitly stated approximation when leaf and air temperatures are sufficiently similar for the purpose. Otherwise calculate the leaf-to-air difference using measured leaf temperature and air vapor pressure separately.
Does a higher VPD mean I need more dehumidification?
No. At fixed air temperature, dehumidification increases air VPD. Determine the direction of the required response and coordinate it with the crop and temperature strategy.


