

A calla lily greenhouse of approximately 1,000 m² in Yunnan expanded its dehumidification configuration from one RYCF-22S unit to two during July 2026. Environmental-control records from three measurement points show a nighttime average relative humidity of 77.1% in the second half of the month, compared with 87.4% in the first half. The share of nighttime intervals below 80% RH increased from 12.5% to 67.3%.
The records also show why greenhouse humidity control cannot be assessed from rated dehumidification capacity alone. Moisture introduced by the evaporative cooling pad, greenhouse airflow distribution, irrigation and changing weather can produce substantial differences within the same structure. Unit quantity affects available dehumidification capacity; measurement-point coverage, airflow paths and operating strategy determine how effectively that capacity addresses the actual moisture load.
Case highlights
- The greenhouse covers approximately 1,000 m², with a height of about 3 m and an internal volume of approximately 3,000 m³.
- The first RYCF-22S unit entered operation on July 1, 2026, and the second was added on July 16, 2026, with a focus on nighttime high humidity from 20:00 to 08:00 the following day.
- Three-point nighttime average relative humidity decreased from 87.4% to 77.1%, while the share of nighttime intervals below 80% RH increased by 54.8 percentage points.
- The fan side and roadside zone spent substantially more time below the observation threshold. The cooling-pad side, adjacent to the evaporative cooling pad, still averaged 84.6% RH at night during the second half of the month and remains the main area for further optimization.
- The recorded plant loss rate was also lower during the same period, but the available data supports an association only and does not attribute the full change to the dehumidification equipment.
Project background: Nighttime high humidity was the main environmental-control issue in July
The greenhouse grows calla lilies and uses an evaporative cooling pad, fans and multipoint environmental monitoring. Across the three measurement points, the average temperature for July was 22.3–22.5°C and remained broadly stable. Persistent nighttime relative humidity was the main condition requiring attention.
The project used 80% RH as the principal observation threshold, with particular attention to the period from 20:00 to 08:00 the following day. During July 1–15, 2026, when one dehumidifier was operating, nighttime average relative humidity was 93.2% on the cooling-pad side, 87.3% on the fan side and 81.7% in the roadside zone. The three-point average was 87.4%, and only 12.5% of nighttime intervals were below 80% RH.
The moisture load did not come from a single source. The crop and growing medium continuously released moisture, irrigation created short-term moisture loads, and evaporative cooling added water to the air. Changes in nighttime ventilation allowed moisture to accumulate more readily inside the greenhouse. A single humidity reading could not represent the full space, so the project retained three measurement points: the cooling-pad side, fan side and roadside zone.
| Project input | Site condition |
| Crop | Calla lily |
| Location | Yunnan, China |
| Greenhouse size | Approximately 1,000 m² and 3,000 m³ |
| Main issue | Nighttime high humidity, especially on the cooling-pad side |
| Primary observation period | 20:00–08:00 the following day |
| Operating objective | Keep RH below 80% as much as practicable during the primary observation period |
| Environmental records | Three measurement points, recorded every 5 minutes |
| Equipment deployed | 2 RYCF-22S floor-standing refrigerant dehumidifiers, deployed in stages |
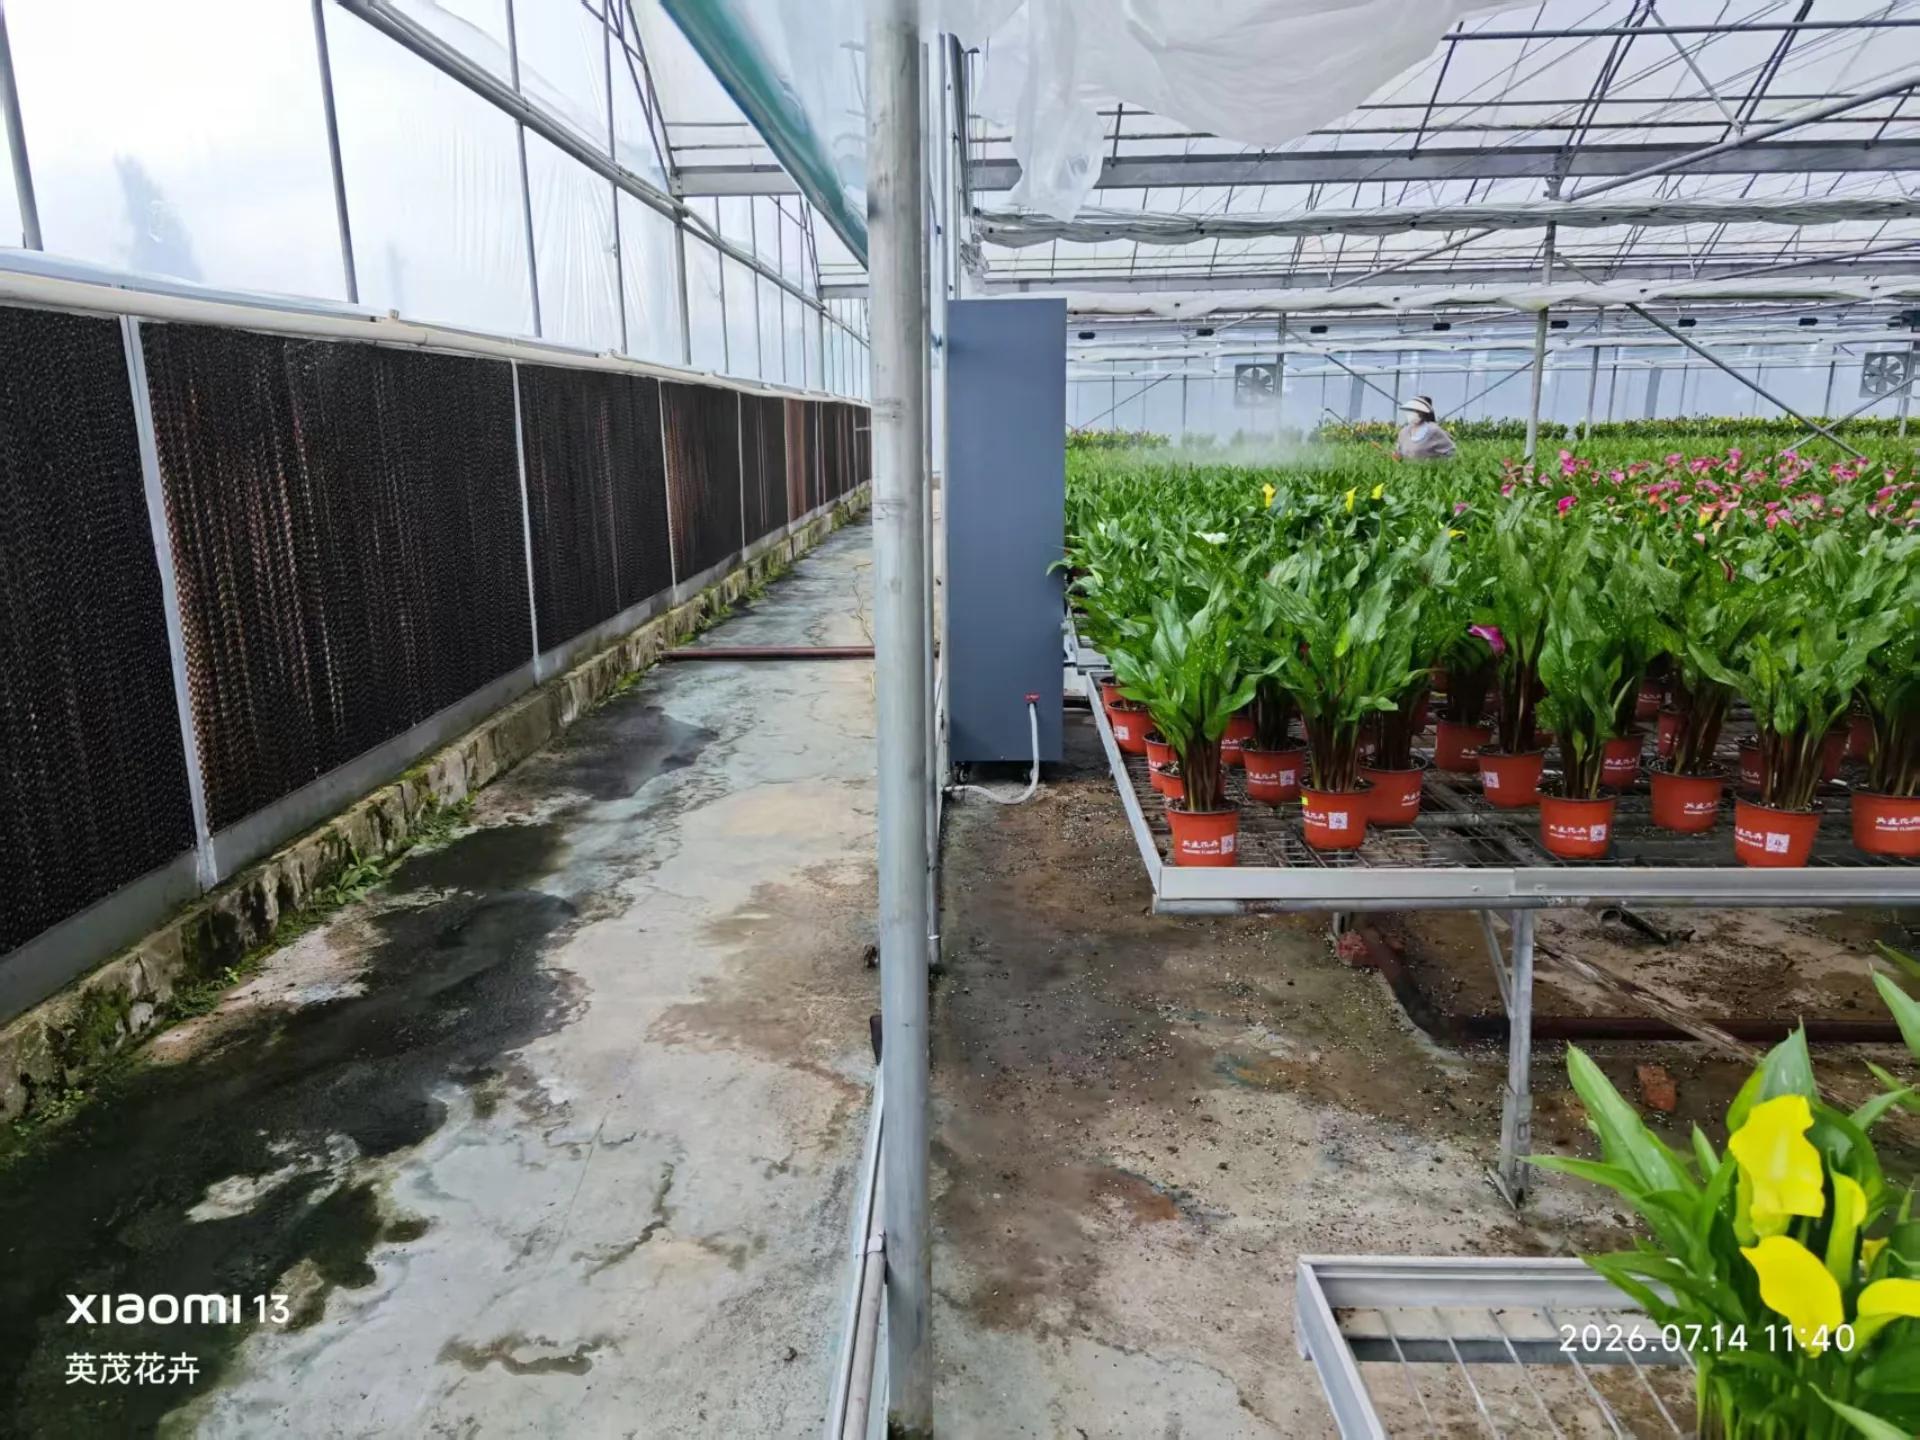
Selection assessment: Rated capacity was only the starting point
The project selected RYCF-22S floor-standing refrigerant dehumidifiers. Rated dehumidification capacity must be read together with its test temperature and relative humidity. When the actual greenhouse temperature is lower than the rated test condition, field capacity decreases, so site results cannot be calculated simply by multiplying rated capacity by unit quantity. The rated parameters for the delivered version still require technical verification against the equipment nameplate or an approved datasheet. This case study does not apply the current catalog parameters retrospectively to the units operating at the site in July.
The selection records considered space volume, temperature and humidity ranges, the control objective, low-temperature conditions, moisture sources, air exchange and enclosure tightness. The resulting configuration used two units. Because the units entered operation in stages, the project created an observational comparison window between one-unit and two-unit configurations. The available records do not include the complete decision process for adding the second unit.
Yakeclimate’s scope in this project covered dehumidification equipment and selection support. Coordination among the cooling pad, fans, ventilation, irrigation and supervisory controls remained the responsibility of the project owner and its climate-control team based on site operation.
Implementation: Two deployment stages and three measurement points
The first dehumidifier entered operation on July 1, 2026, and the second was installed on July 16, 2026. The units operated continuously at night, with a recorded controller setpoint of 60% RH. The project control objective and the observation threshold used in this analysis were 80% RH. These figures serve different purposes: 60% RH was the controller setting recorded for equipment operation and does not mean that the greenhouse had reached, or was required to maintain, that humidity level.
July 1–15, 2026, was defined as the one-unit stage, and July 16–31, 2026, as the two-unit stage. The team used the same three-point records to compare 24-hour, daytime and nighttime average relative humidity, together with the share of nighttime intervals below 80% RH.
This method provided a more representative assessment than reading the dehumidifier display alone. The cooling-pad side, fan side and roadside zone revealed differences across the greenhouse, reducing the risk of treating one location below the threshold as evidence that the entire space was controlled. The available material does not include measurement-point coordinates, prevailing airflow direction or a sensor-layout drawing, so this case study does not assign a more specific airflow function to each point.
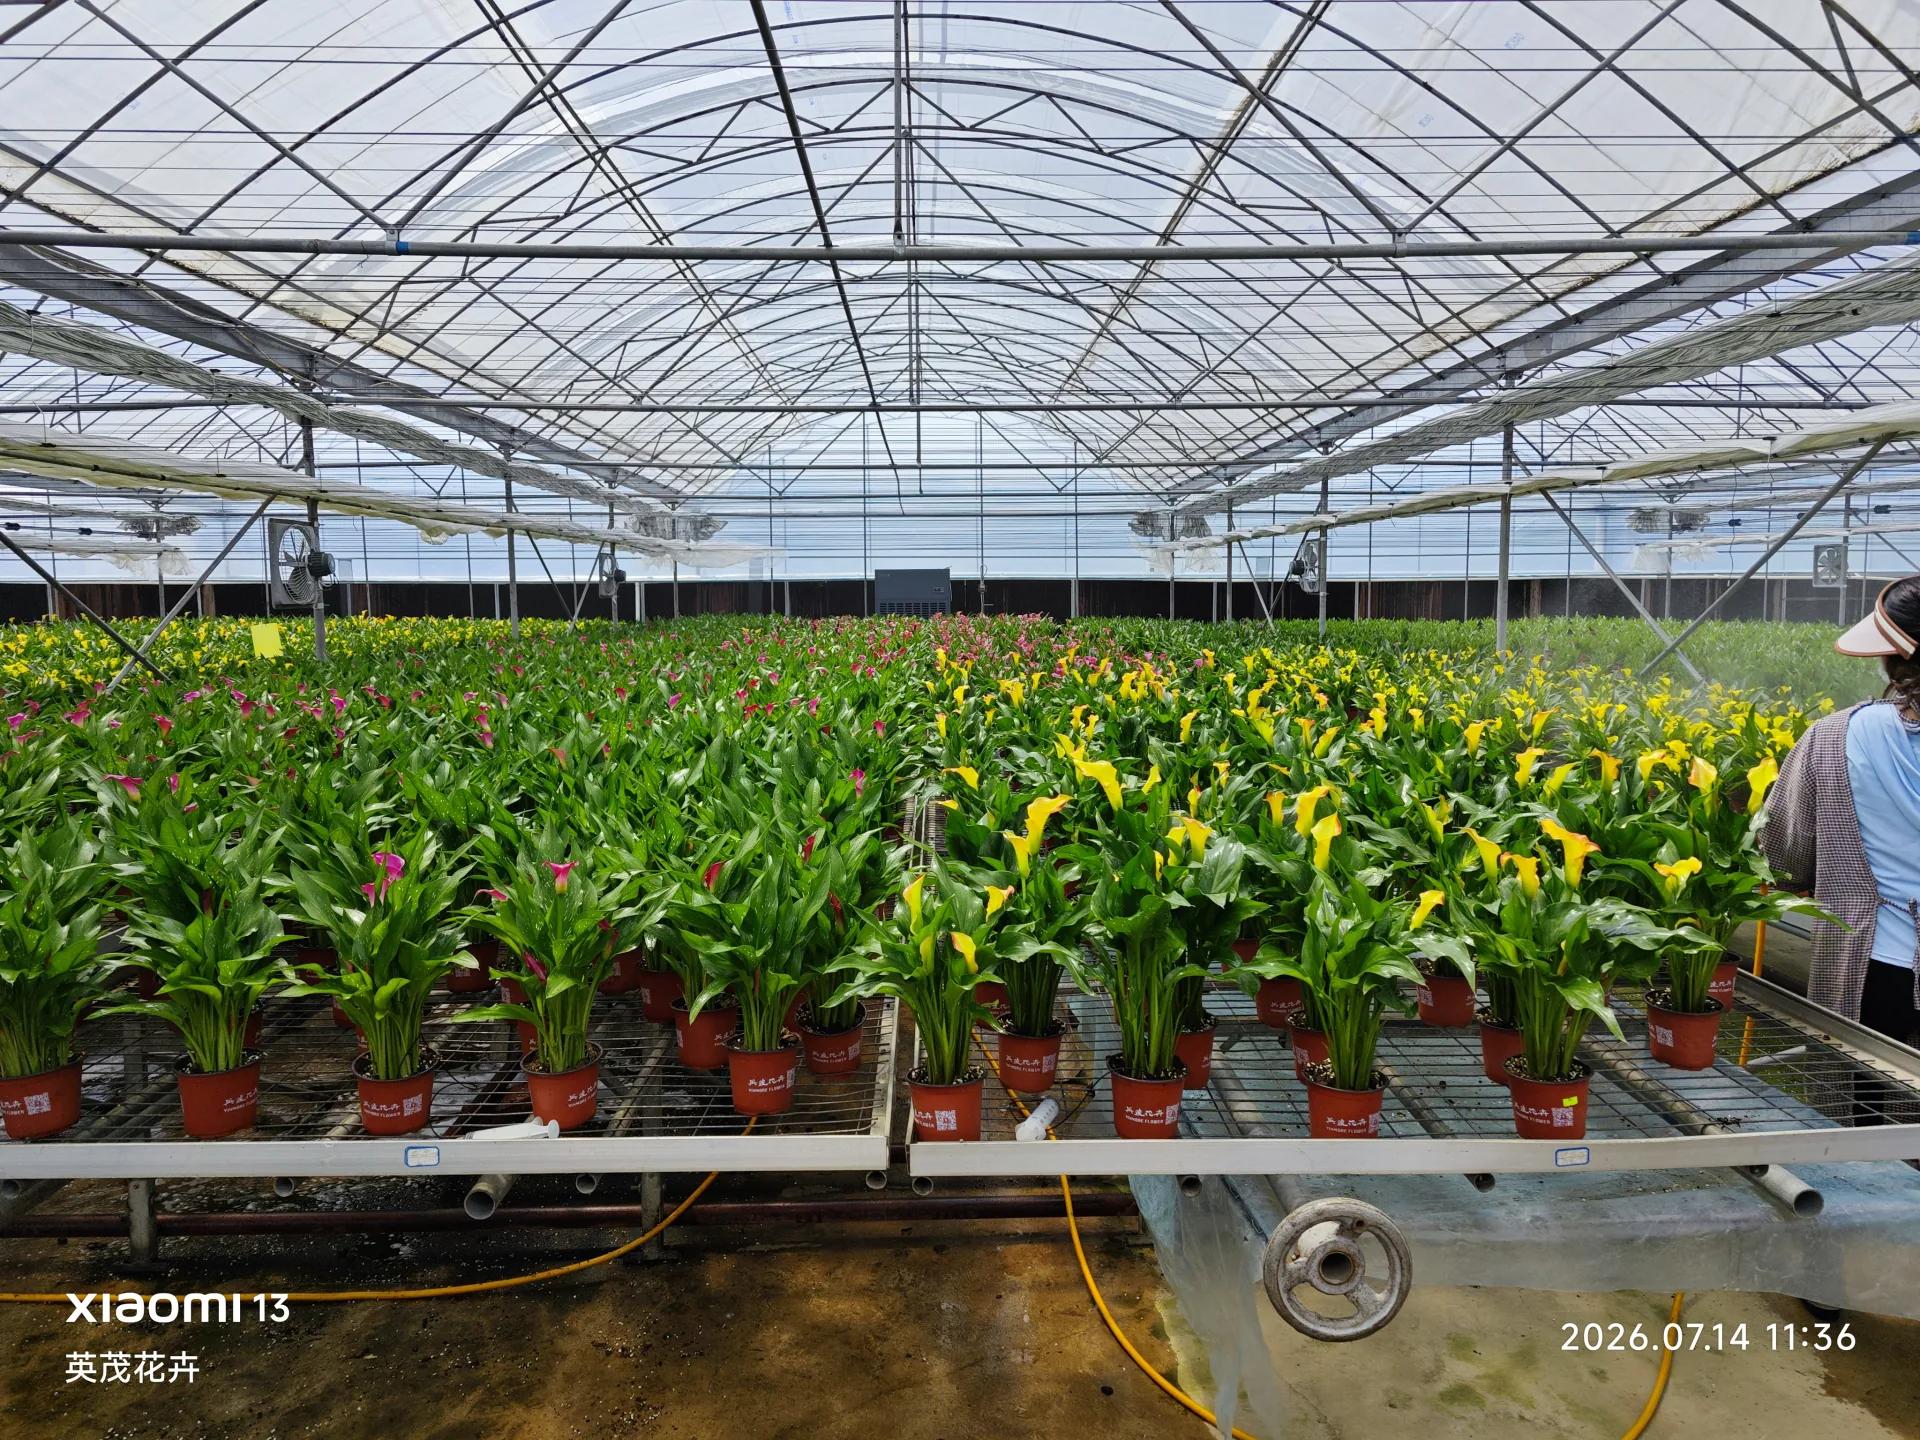
Stage results: Nighttime average relative humidity decreased to 77.1%
From the one-unit stage to the two-unit stage, the three-point nighttime average relative humidity decreased from 87.4% to 77.1%, with the project report recording a change of 10.2 percentage points. The share of nighttime intervals below 80% RH increased from 12.5% to 67.3%. The 24-hour average relative humidity decreased from 85.3% to 78.5%, while the daytime average decreased from 83.3% to 79.9%.
| Three-point average metric | One-unit stage<br>July 1–15, 2026 | Two-unit stage<br>July 16–31, 2026 | Change |
| 24-hour average relative humidity | 85.3% | 78.5% | -6.8 percentage points |
| Nighttime average relative humidity | 87.4% | 77.1% | -10.2 percentage points* |
| Daytime average relative humidity | 83.3% | 79.9% | -3.4 percentage points |
| Share of nighttime intervals below 80% RH | 12.5% | 67.3% | +54.8 percentage points |
* Values shown in the table are rounded. The change is reproduced from the methodology used in the project analysis report.
The scale of change differed across the three measurement points.
| Measurement point | Nighttime average RH: one-unit stage | Nighttime average RH: two-unit stage | Share of nighttime intervals below 80% RH: one unit → two units |
| Cooling-pad side | 93.2% | 84.6% | 0% → 27.3% |
| Fan side | 87.3% | 75.1% | 0.6% → 80.5% |
| Roadside zone | 81.7% | 71.8% | 36.9% → 94.1% |
The fan side and roadside zone were below 80% RH during most nighttime intervals in the two-unit stage. Although nighttime average relative humidity on the cooling-pad side decreased by 8.6 percentage points, it still averaged 84.6% in the second half of the month, and 72.7% of nighttime intervals remained above 80% RH. This difference indicates that extending dehumidifier operating time is not the only available adjustment. Drying the cooling pad after operation, local airflow distribution and nearby moisture sources must be considered together with the dehumidification equipment.
The daily records show a temporary humidity rebound around July 20, 2026. Project notes marked these observations as “possibly after irrigation” or “rainy day/after irrigation.” The records did not isolate weather and irrigation effects, so they establish only that short periods of high humidity remained during the two-unit stage. They do not support assigning the rebound to a single variable.
The recorded plant loss rate was also lower, but the current evidence supports association only
The project compiled the recorded plant loss rate for three cultivation batches. Most of the earlier batch’s growing cycle occurred either without dehumidification or with one unit in operation, and its recorded plant loss rate was 22.40%. The following two batches corresponded respectively to a one-unit transition stage and a stage in which the configuration gradually increased to two units. Their recorded plant loss rates were 12.88% and 8.76%.
| Cultivation batch | Dehumidification coverage | Recorded plant loss rate |
| Batch 6 | No unit during the earlier period; 1 unit added later | 22.40% |
| Batch 7 | One-unit transition stage | 12.88% |
| Batch 8 | Gradual expansion to 2 units | 8.76% |
The direction is consistent with the humidity records: batches with greater dehumidification coverage also had lower recorded plant loss rates. However, planting dates and cultivation cycles differed across the three batches. Weather, irrigation, disease pressure and routine management may also have changed, and plant-loss counts typically lagged conditions by 5–7 days. The current data therefore cannot establish that dehumidification equipment caused the full reduction, nor can it support a promise that another greenhouse would achieve the same proportional change.
A stronger validation method would retain humidity, temperature, irrigation, weather, disease and plant-loss records by batch and compare them within the same statistical window. The independent contribution of humidity control can be assessed more reliably only when the variables and time periods are sufficiently clear.
Four engineering findings from this agricultural dehumidification case study
1. Greenhouse dehumidification requires multipoint verification
A three-point average below 80% RH does not mean every location is below the threshold. The cooling-pad side remained higher, showing that dehumidifier placement and airflow delivery must be assessed against the greenhouse airflow path.
2. An equipment setpoint is not a field result
A controller setting of 60% RH is one part of the operating strategy. The humidity achieved in the greenhouse still depends on moisture load, temperature, air exchange, equipment capacity and operating time.
3. Rated dehumidification capacity must include its test conditions
Rated capacity must be stated together with the test temperature and relative humidity. Actual capacity changes when temperature falls, inlet-air conditions change or the moisture load fluctuates. Project selection must confirm the operating temperature range and cannot be based only on floor area or rated capacity. Specific model parameters should be taken from the delivered unit nameplate or an approved datasheet.
4. Operating records are more informative than a single spot reading
The staged records from one unit to two revealed differences between the two equipment configurations and identified the remaining limitation on the cooling-pad side. Continued monitoring is needed to determine whether the equipment configuration, operating period or other environmental-control actions require adjustment.
Applicability boundaries and further optimization
The evidence supports the following conclusion: under the July 2026 operating conditions in this calla lily greenhouse of approximately 1,000 m², nighttime humidity metrics improved after the configuration expanded from one RYCF-22S unit to two, and the fan side and roadside zone were below 80% RH during most nighttime intervals. The project result has passed internal review and is accepted as a confirmed long-term operating result, but it does not provide a performance guarantee for other crops, other greenhouse structures or future projects.
Further work should focus on three actions:
- Reduce unnecessary moisture addition from the cooling pad when temperature conditions allow, and provide enough airflow for the pad to dry after shutdown.
- Extend dehumidifier operation during rainy weather, after irrigation and during periods of nighttime high humidity, while recording the corresponding temperature and humidity changes.
- Continue monitoring the cooling-pad-side measurement point and the recorded plant loss rate of later batches, then review humidity and crop outcomes within the same time window.
What information is needed to prepare a greenhouse dehumidification project?
Greenhouses with the same floor area may require substantially different equipment configurations. Before project review, provide the crop and growth stage, greenhouse dimensions, daytime and nighttime temperature and humidity ranges, target humidity, irrigation and cooling-pad operating methods, ventilation and fan conditions, main moisture sources, available power supply, drainage location, equipment-placement restrictions and at least one week of multipoint environmental records.
Yakeclimate designs and manufactures industrial dehumidification equipment for complex climate applications, with a focus on agriculture and energy projects. Using these inputs, we can review the equipment type, rated conditions, likely unit-count range, placement conditions and necessary interfaces, then support an equipment-level fit review with the project owner or climate-control team.
Explore agricultural dehumidification equipment and project inputs | Submit your greenhouse operating conditions
FAQ
Frequently asked questions
Why did one unit not keep nighttime RH below 80%?
During July 1–15, 2026, the three-point nighttime average relative humidity was 87.4%. This indicates that one unit did not provide sufficient coverage under the moisture load, airflow and operating conditions present during that stage. The cooling-pad side had the highest average humidity, also showing that the issue involved both total dehumidification capacity and local moisture addition and air distribution.
Why did the cooling-pad side remain high after the second unit was added?
The evaporative cooling pad adds moisture to the air entering the greenhouse, creating a higher local moisture load nearby. During July 16–31, 2026, nighttime average relative humidity on the cooling-pad side was still 84.6%. Further work should address cooling-pad operating time, drying after shutdown and local airflow instead of relying only on a controller adjustment.
Can another 1,000 m² greenhouse use the same two-unit RYCF-22S configuration?
Not without a project-specific assessment. The same floor area does not imply the same internal volume, crop transpiration, irrigation, evaporative cooling, air exchange, temperature or target humidity. RYCF-22S rated data is one selection input only. Final unit quantity must be confirmed against the actual moisture load, low-temperature capacity, airflow coverage, power supply, drainage and control conditions.
Data notes
This case study uses two internal project documents: the “Dehumidifier Selection Proposal,” which records the space, control objective and equipment model; and the “July 2026 Calla Lily Environmental Control and Plant Loss Correlation Analysis Report,” which compares the one-unit stage from July 1–15, 2026, with the two-unit stage from July 16–31, 2026. Environmental data came from three measurement points on the cooling-pad side, fan side and roadside zone, with readings recorded every 5 minutes. The raw time-series data is not published with this article. July 2026 remains the quantified comparison window published here. The project has passed technical and data review and is accepted as a confirmed long-term operating result; no unpublished later-period figures are introduced in this article.


