
Humidity is one part of the environment affecting a crop. Relative humidity, vapour pressure deficit and leaf wetness answer different questions. Use them alongside temperature and crop observations; none is a complete diagnosis or a universal growth target.
What RH and VPD describe
Relative humidity compares actual vapour pressure with saturation vapour pressure at the measured air temperature. Air VPD is the difference between those two pressures. The same RH can therefore correspond to different air VPD values at different temperatures. FAO's meteorological guidance explains these quantities and the saturation-pressure calculation.
A leaf-to-air calculation instead uses saturation pressure at leaf temperature for the leaf side of the comparison. Assuming the air spaces inside the leaf are saturated, it estimates a vapour-pressure gradient; it does not measure the actual transpiration rate. The recorded leaf temperature and the nearby air measurement both matter.
MSU Extension's VPD explanation connects the gradient with water loss and distinguishes propagation from later production stages. That distinction is a reason to identify the crop and stage before applying advice. It is not a universal prescription for all greenhouse plants.
Low and high VPD describe demand, not measured water loss
At the same leaf and air temperatures, more humid surrounding air means a smaller water-vapour pressure gradient from the leaf to the air. Under otherwise similar leaf, stomatal, and transport conditions, that smaller gradient represents less atmospheric demand for water. Drier air or a larger VPD represents greater atmospheric demand, as the MSU Extension explanation describes. It remains a driving gradient, however, rather than a direct measurement of the crop's transpiration.
Relative humidity alone cannot establish that transpiration is zero, and room air at 100% RH cannot justify saying that leaves at different temperatures are all non-transpiring. Nor should a larger VPD be treated as proof that transpiration will keep rising. The abstract of a 1995 summer greenhouse cucumber study reports increased transpiration at high atmospheric VPD followed by reduced stomatal aperture; it also identifies radiation, leaf-to-air temperature difference, and exposure duration as influences on the response (PubMed abstract). This observation concerns cucumber under the studied summer conditions, not a response guaranteed for every crop. For further context, see stomatal response to greenhouse humidity.
Record the estimated gradient separately from any measured water flux. Without a water-flux measurement, the actual transpiration rate remains unknown.
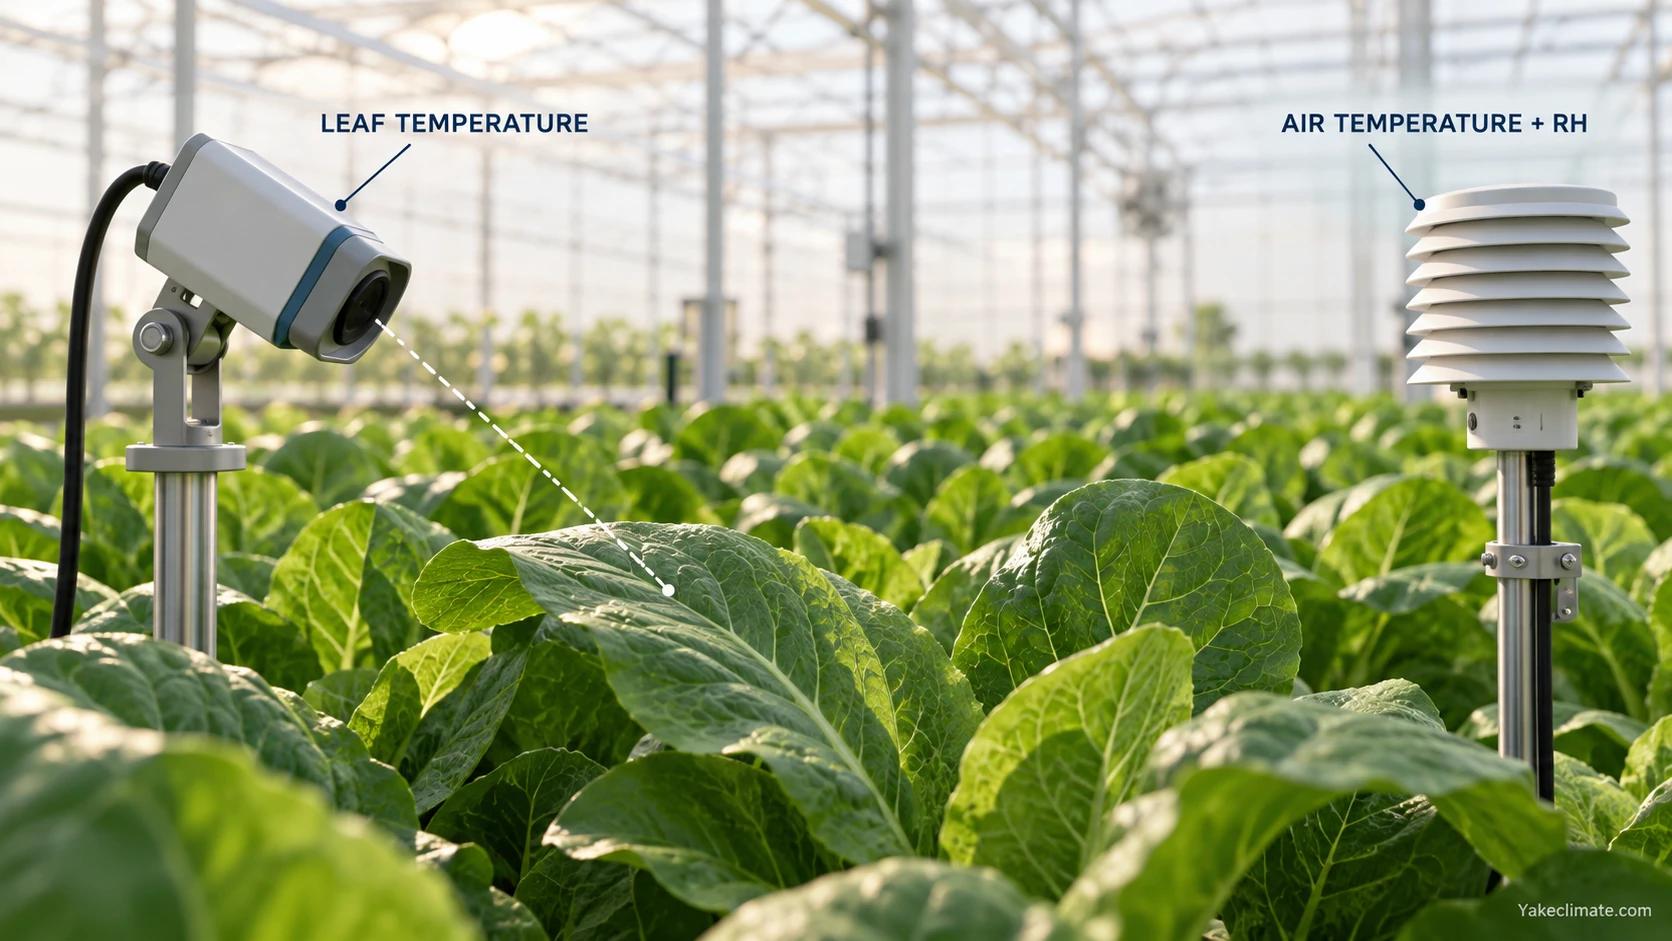
Leaf temperature and air temperature are separate inputs.
A worked temperature example
For an instantaneous comparison, use temperatures in °C and pressures in kPa:
es(T) = 0.6108 × exp[17.27 × T / (T + 237.3)]
Actual vapour pressure = es(Tair) × RH / 100
Air VPD = es(Tair) − actual vapour pressure
Leaf-to-air VPD estimate = es(Tleaf) − actual vapour pressure
The saturation-pressure expression is from FAO; the following values are calculated examples, not measured crop results.
| Quantity | Example input or result |
| Air temperature and RH | 24°C and 70% |
| Assumed measured leaf temperature | 22°C |
| Actual air vapour pressure | 2.089 kPa |
| Air VPD | 0.895 kPa |
| Leaf-to-air VPD estimate | 0.555 kPa |
Rounded to two decimal places, the two deficits are 0.90 and 0.56 kPa. This difference belongs to the stated example. It does not show that leaves are always cooler than air, that every crop differs by the same percentage or that either value is a suitable target.
Interpret the number with the crop record
Before describing a reading as too high or too low, identify what the recommendation actually refers to: air or leaf VPD, measurement location, crop, stage and time period. A target without those details is difficult to apply or test.
Keep separate records for the room controller and the crop location under investigation. Record light and dark periods rather than assuming one represents the other. If a leaf temperature was estimated instead of measured, preserve that distinction in the calculation sheet.
A pressure difference also cannot identify the cause of a damaged leaf or fruit. University of Maryland's blossom-end rot guidance discusses calcium shortage in developing fruit and several contributing growing conditions, including inconsistent watering. A humidity trace does not establish whether the root zone, nutrient supply or another crop factor needs correction. Refer symptoms for crop assessment rather than treating a VPD adjustment as a diagnosis.
Keep condensation observations separate
Dew point describes the temperature at which the sampled air reaches saturation on cooling. Compare it with the surface temperature of the location being assessed. A room RH value alone does not tell you whether a particular leaf was wet.
For an investigation, record visible droplets, their location and duration separately from the climate calculation. Note whether water followed irrigation, dripping or a cooling period. These are observation categories; they do not prove a disease or its cause.
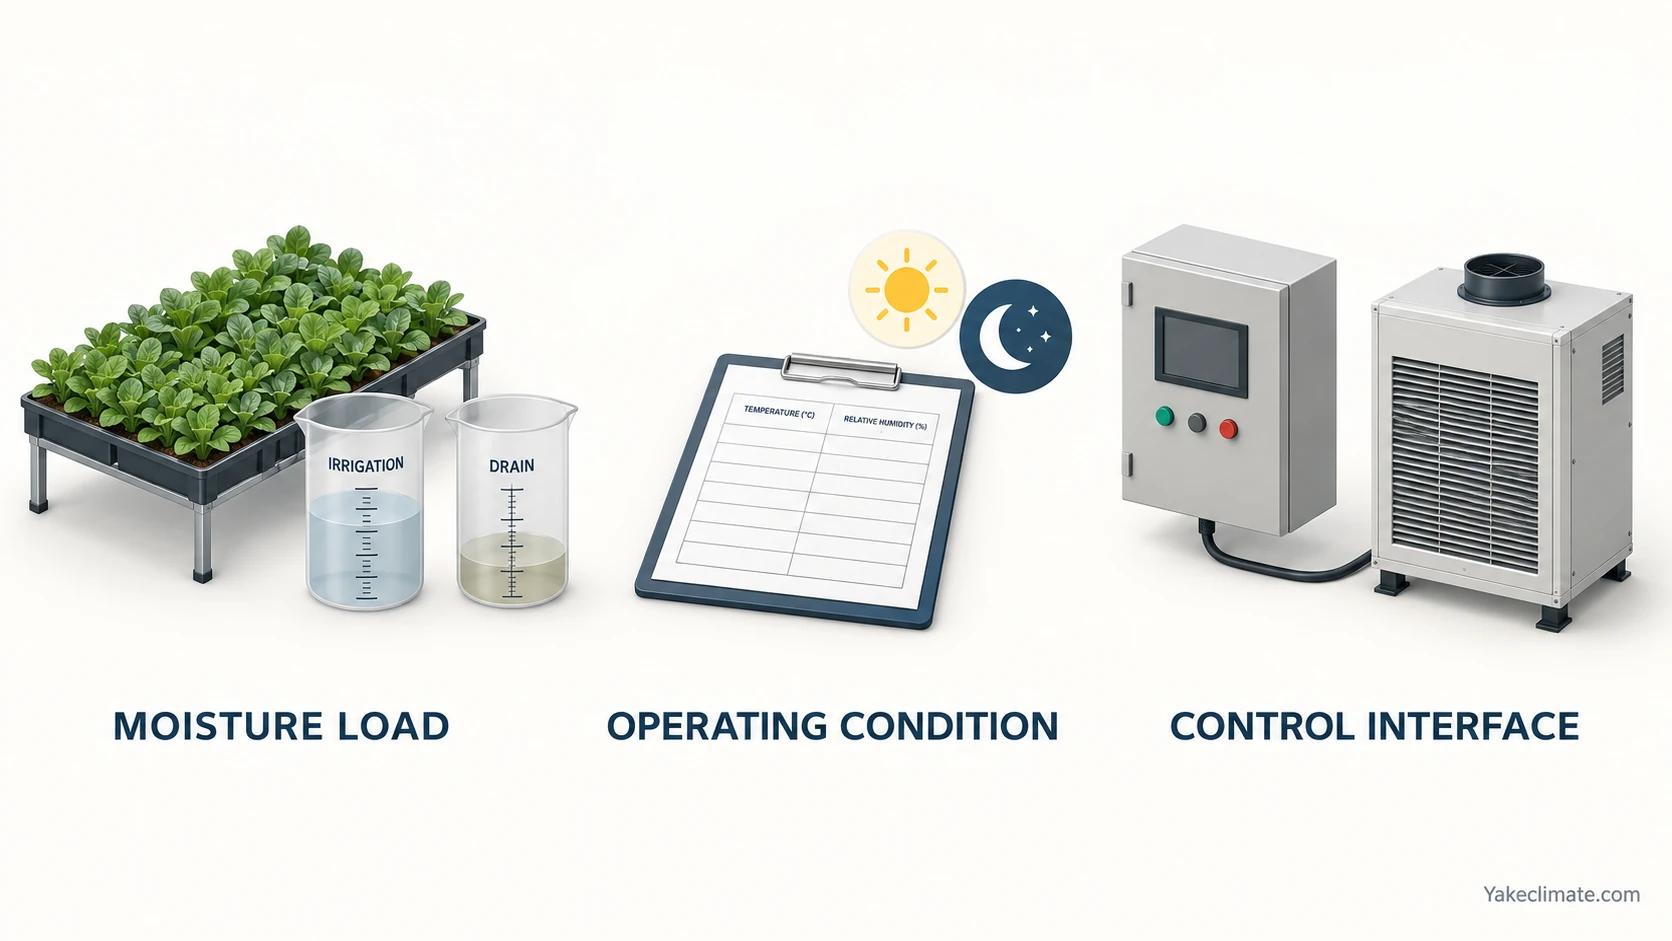
Keep water records, operating conditions and equipment interfaces in the same brief.
Build a record that supports a decision
Use the same time stamps across the following records so that the crop and equipment teams can examine the same event.
| Record | Include | Question it helps frame |
| Air measurements | Temperature, RH, sensor identity and position | Which air condition was used in the calculation? |
| Leaf or surface measurements | Location, method and time | Was temperature measured or assumed? |
| Crop observations | Crop, stage, symptom location and onset | What needs a crop-specific assessment? |
| Operation | Irrigation, lighting, vents and equipment state | What changed before and during the event? |
For a broader explanation, see greenhouse humidity control. Where CO₂ is being managed, retain its own measurements and consult the CO₂ uptake discussion; a humidity reading does not establish uptake.
If the record identifies an equipment-duty question, compare ventilation and dehumidification and check the conditions behind water-removal ratings. The agriculture and ceiling dehumidifier pages provide product context. The RYDZ-10S product page lists 240 L/24h at 30°C and 80% RH, 2,500 m³/h airflow and an applicable temperature range of 5–38°C. These entries do not promise the rated capacity throughout that range. Bring the recorded conditions to project contact before using a catalogue rating as a crop-climate specification.


