
Building 34, No. 535 Shunfeng Road, Hangzhou, Zhejiang, China
[email protected]


Global energy storage project databases are organized digital resources that monitor installed and scheduled storage systems by geography, technology, capacity, and deployment status. They provide engineers, planners, and investors a single location to examine project pipelines, compare technologies such as lithium-ion, flow batteries, and thermal storage, and analyze trends in grid-scale and behind-the-meter applications. A number of databases now connect storage assets to renewables, grid services, and policy schemes so users can understand how storage underpins capacity, flexibility, and reliability. Parameters typically comprise power rating in megawatts, energy in megawatt-hours, commissioning year, ownership, and use case. To facilitate equitable and transparent planning, these databases strive for uniform taxonomy, open formats, and frequent updates, which the subsequent sections decompose.
Global energy storage project databases are organized collections of storage assets that are constructed, being constructed, or planned globally. They monitor who constructed what, its location, the technology it employs, and its performance across time. For plant and facility teams, they serve as an unbiased “single source of truth” when you need to benchmark risk, cost, and performance prior to connecting your processes or climate-control loads to storage-backed power.
These databases improve transparency in energy markets where project claims are sometimes nebulous. Transparent, comparable capacity, duration, and use case data enable investors, regulators, and operators to make evidence-based decisions, not hype-based ones. This same mindset is useful in industrial climate control. The way you would check humidity specs, energy draw, and lifetime cost for a dehumidifier, grid planners now check storage data with similar rigor.
By putting hundreds or thousands of projects side by side in one place, databases make it easier to compare regions, identify cost curves, and track which chemistries or configurations transition from pilot to scale. That type of benchmarking feeds into practical planning. For example, a plant that wants to pair rooftop PV, battery storage, and high-efficiency dehumidifiers can look at similar setups in other markets and judge what is realistic on cost and uptime. Over time, these databases track how quickly storage is installed, where policy succeeds, and where bottlenecks hamper the build-out. All of this connects back to the pace of the broader energy transition.
Most global databases cover a wide spread of storage technologies: lithium-ion battery systems in containerized formats, pumped hydro storage in the 100 MW to multi-gigawatt range, compressed air energy storage, flywheels, and sometimes thermal storage such as molten salt tanks or chilled-water tanks used for time-shifting cooling loads. Others flag behind-the-meter systems in factories or logistics hubs when they’re large enough to impact local grids.
Inclusion criteria vary, but typical cut-offs are a minimum power rating of at least 1 MW or an energy capacity threshold of at least 1 MWh. Some databases include just commissioned, under construction, or final investment decision projects, while others include announced or planned phases. This makes it easier for users to track pipelines but requires more caution when using the data. There are global platforms, European-only or Asia-Pacific-only views of lists, and country-level registers with deep dives into small and medium systems. Time coverage extends back a few decades for pumped hydro, with more recent battery storage beginning around 2010, along with forward-looking columns for anticipated commissioning year. That history enables you to follow how storage couples with fresh loads like high-precision HVAC and dehumidification in new-age plants.
Their primary sources are typically government agencies, energy regulators, and grid operators who publish interconnection approvals, capacity registers, and market participation data.
Databasemakers then supplement company disclosures with data from utilities, IPPs, and technology vendors, and frequently conduct structured surveys so project developers can provide more granular data points like use case, round-trip efficiency, or co-located loads such as industrial HVAC.
Third-party datasets from market researchers, public environmental impact assessments, and financing reports fill remaining gaps and help cross-check claims on size or status.
Most databases track basic technical metrics, including power capacity in megawatts (MW), energy capacity in megawatt-hours (MWh), technology type, and commissioning date.
Location is typically coded to country, region, and sometimes GPS coordinates, as well as ownership, operator, and project status (announced, under construction, operating, retired). This information is important if you are examining supply security for a cluster of energy-intensive plants.
Where available, financial metrics like capital cost, main funding source and support schemes provide context for cost benchmarking.
For quick use, it helps to keep a short internal checklist of “must-have” fields: MW, MWh, technology, use case, start year, location, status, main owner, and when you can get it, cost per kW and per kWh.
To keep trust high, maintainers cross-check each project against no less than two sources, like a regulator list and a developer press release, then tag confidence levels for every data field.
As with some big databases, independent audits or expert panels sample entries, verify technical plausibility, and review methods. Quality teams in the industry audit process and environmental data.
When conflicts arise, such as two different capacity values, clear rules determine which source prevails or they record a range and flag the entry as under investigation, so users can observe ambiguity rather than covert changes.
Transparent rules and visible version histories are important because grid planning, industrial siting, and long-term contracts now rely on these figures.
Update cycles vary from near real-time feeds associated with market platforms to quarterly or annual refreshes depending on the region and staff capacity.
More rapid updates provide more timely trends only if they maintain data quality. The top databases balance speed with checks and display both “most recent project update” and “most recent methodology update” dates.
New projects typically come in through submission forms or API links, go through validation and then land in public view. Cancelled or retired projects change status rather than disappear, which prevents false growth signals.
Users should always observe the last update and scope notes before relying on any numbers for long-term plant planning or for sizing new dehumidification and climate-control loads under storage-backed power.
Global energy storage project databases serve a diverse range of users. Each group extracts different fields from the same records to address their respective planning, finance, or technical challenges. The most effective tools facilitate straightforward cross-verification of assumptions and identification of gaps.
Policymakers and energy agencies use these databases to understand how much storage is currently deployed by region, technology, and grid level. They review entries from tools like the DOE Global Energy Storage Database or national open-access maps to monitor deployment by MW and MWh, if assets are in front of or behind the meter, and how they align with load pockets or weak grid nodes.
That perspective informs policy and code development. It informs targets for storage capacity, grid connection regulations, and support programs such as feed-in tariffs or capacity payments. Cross-country data comparisons help establish targets that correspond with actual build rates, not wishful thinking. Over time, they return to the same database to see if incentives are causing real projects to get over the finish line or if rule changes are decelerating permits or financing.
Investors use energy storage databases as a first screen for deal flow. They look for things like project status, technology type, expected revenue streams and counterparties to locate markets that match their risk and return profile. For due diligence, they cross-reference records with grid maps like OpenInfraMap to view local network strength and nearby generation.
They require fresh, time‑stamped data to move capital quickly toward projects that hit key milestones, such as offtake agreements signed or construction commencement. Many funds follow entries over months or years to observe trends in chemical selection, system size, or co-location with solar and wind, so they can get ahead in new market niches.
Researchers, students, and analysts use these databases for academic and practical applications. They extract granular data at the level of storage duration, cycle life claims, and use-case tags to model power systems, analyze the costs and benefits of various storage technologies, and simulate future grid scenarios.
Open‑access project maps and tools such as Renewables.ninja enable them to mix storage data with simulated hourly wind and solar output to research how storage smooths variable resources. Analysts and scholars then take this aggregated data to publish research on technology adoption rates, grid stability, and long‑term system costs.
| Researcher type | Typical use case | Main benefit |
|---|---|---|
| Grid modelers | Capacity expansion and unit‑commitment studies | Better forecasts of storage build‑out |
| Tech‑cost analysts | Learning‑curve and cost–benefit assessments | Clearer view of levelized storage costs |
| Policy researchers | Impact studies of new storage regulations | Evidence for design of future policies |
| Students and early‑career | Theses on storage, renewables, and flexibility | Reliable real‑world datasets for projects |
Developers dig through these databases to identify who is constructing something similar and where. They use these databases, for example, to benchmark system sizes, chemistries and business models against existing projects to see if their designs are on the market or if they need a different angle. By mapping over entries to grid and land-use layers, they can identify areas with quality wind or solar but minimal storage or identify regions with stressed substations that might appreciate grid-support services.
They rely on database tags for regulations, permits and incentive programs associated with each project, which allows them to follow evolving requirements without beginning every jurisdiction scouting from scratch. A lot watch update feeds or filter for new projects by EPC, OEM or owner, using that as a live map of potential partners, key suppliers and future customers of integrated climate-control equipment in warehouses.
Global energy storage project databases seem complete on the surface. Data blind spots lurk in key locations that matter for design, risk, and long-term planning. These blind spots are elements of the image that no one records or verifies — usually because the information is difficult to collect, prejudiced, or not yet common practice. It lists the most frequent blind spots and why they’re relevant if you operate large, energy‑intensive plants that already monitor climate control, dehumidification loads, and power quality extensively.
| Coverage Gap | Typical Cause | Practical Impact for Industry Users |
|---|---|---|
| Emerging market projects | Weak reporting, language barriers | Missed sites, wrong benchmark costs and timelines |
| New / hybrid technologies | No clear taxonomy, vendor opacity | Underestimating risk, sizing faults, poor technology comparisons |
| Real operational performance | Limited SCADA/API sharing | Wrong assumptions for uptime, cycling, and maintenance planning |
| Decommissioning and end-of-life | No mandate, scattered local records | Poor lifecycle, circularity, and ESG assessments |
Without mending these holes, databases provide tidy dashboards but may promote bad siting decisions, incorrect technology selections, and under-scale balance-of-plant systems like HVAC and dehumidification. Ongoing data growth, improved field standards, and explicit blind spot priorities are necessary if these instruments are to assist sustained, efficient initiatives rather than warp them.
Data coverage for storage projects in most developing areas is sparse or delayed. Public trackers can list a big battery by nameplate power but miss chemistry, use case, or actual commissioning date. Local papers, non-English reports, and off-grid or behind-the-meter systems do not often flow into global datasets, so the scale of adoption is under-counted.
Data blind spots here arise from weak reporting rules, limited digital records, and fragmented utility structures. This pattern echoes other areas such as health care or environmental monitoring, where absent rural or informal-sector data conceals actual danger and complicates planning. For energy storage, it signifies that planners rely on figures from a handful of mature markets and then transplant them into weather conditions and electrical grids that perform quite differently.
Future database efforts should approach these areas as priority lists. They should reach out to regulators, large industrial users, and EPC firms to extract structured, verifiable records.
Projects that employ new or hybrid storage notions tend to rest on the fringe of existing data standards. Liquid-air, metal-air, gravity systems, flow batteries with mixed chemistries, or thermal storage tied to HVAC and dehumidification all get lumped into “other” or omitted. This lag obscures where risk and learning are truly greatest.
It’s difficult to standardize data for technology that moves this fast because the underlying disciplines are still shifting. Round-trip efficiency, degradation patterns, and safety regimes vary greatly between, for example, lithium iron phosphate, vanadium redox, and compressed air in a salt cavern. If a database boxes them into a single ‘battery’ profile, measurement errors and sampling bias sneak in, and decision-makers receive incomplete or biased outcomes.
Databases function best when their schemas remain malleable. That implies modular taxonomies, optional fields for emerging chemistries, and room for sustainability metrics like embodied carbon, recyclability, or humidity-sensitive parts. Flagging all “new or hybrid” technology projects as such and tagging them for more detailed project-level data gathering allows researchers to conduct targeted research on safety, performance, and circularity without contaminating the larger dataset.
Most global trackers concentrate on headline specifications and commercial mileposts. Real-time or even monthly operational data is uncommon. Most entries end with rated power (MW), rated energy (MWh), and an in-service date with no insight into how these assets perform in daily operation or under stress.
That absence of operational intelligence leads to a significant blind spot. It restricts judging if plan plants meet lifetime goals, how often they cycle, or how vulnerable they are to ambient temperature and humidity. For industries that rely on controlled internal climates, this blind spot can obscure connections between storage operation, waste heat, indoor moisture loads, and sizing of dehumidifiers or ventilation.
Key missing operational fields often include:
Developing a canonical table of which of these fields each major database already supports can drive convergence. It provides plant teams a concise menu when they share their own data or negotiate access with vendors and integrators.
Data on retired or decommissioned storage projects is generally absent. Databases frequently retain assets labeled ‘operational’ well beyond repowering, failure or removal, or toggle status without documenting what truly occurred to hardware, enclosures or balance-of-plant systems.
End-of-life data is key for any serious lifecycle and circular-economy work. It displays actual service lifespan, battery or tank repurposing, recycling channels, and housings, wiring and HVAC equipment destinations. Absent this, sustainability studies are at risk of the same data blind spot as in other fields, where infrequent yet highly impactful end-of-life events never make it into the record and thus remain invisible in policy and design.
For example, standardized reporting on decommissioning should include dates, root causes, removal methods, material recovery rates and site restoration measures. Including an explicit “decommissioning status” and “end-of-life pathway” as mandatory fields in subsequent database updates would generate clear signals to regulators, investors, and industrial users planning long-timeline assets and pairing storage with robust, efficient dehumidification and climate-control infrastructure.
Country-level capacity data in global storage databases provides a concrete baseline for who leads, who is closing in, and where new industrial risk and opportunity lie, particularly for power-hungry plants and climate-sensitive production lines.
Let’s start by extracting a simple ranked list of countries by total installed storage capacity from a reliable source like the DOE Global Energy Storage Database, which follows 1600+ grid-level projects. Cross-check that list against recent battery additions since installed capacity is now around eleven times higher than in 2021 and 108 GW of new battery storage came online in 2025 alone, which is 40% more than in 2024.
China today typically dominates battery storage capacity additions, accounting for approximately 60% of global additions projected to occur in 2025, with the US trailing behind and Europe collectively in the third position. A large portion of this capacity is utility-scale, about 80% of new battery capacity in 2025, linked to large solar and wind plants and major load centers serving industrial areas and heavy manufacturing corridors.
Leadership is defined by policy and demand. The US aims for approximately 600 GWh of capacity by 2030, propelled by federal tax credits, state-level mandates, and peak-shaving requirements during severe weather events that jeopardize grid stability for factories, data centers, and cold-chain logistics. China’s industrial policy, rapid grid build-out, and strong domestic battery supply chain underpin massive clusters of utility-scale storage near coastal industrial hubs and inland renewable bases.
As you examine these leaders, follow its evolution over time in this database. Year-by-year charts of total installed capacity by country show if a region is holding on to its lead, losing share, or being passed by faster movers. This counts if you’re planning long-life assets like large drying or dehumidification systems that rely on stable, affordable power.
Growth regions distinguish themselves with sharp year-on-year increases in installed megawatts or megawatt-hours by country. It’s worth being on the lookout for markets where capacity in absolute terms may still be modest, but where growth rates are strong and the database’s project pipelines are dense.
Common drivers are grid modernization, increasing shares of variable renewables, and high power quality sensitivity. Australia is an obvious case in point, combining robust momentum in large battery projects co-located with solar and wind, with “big battery” mini-grids that smooth frequency and support remote mining and processing locations. A number of additional countries in the Middle East are moving rapidly, pairing solar build-outs with new storage to maintain gas generation for export and maintain solid system reliability.
These regions have an obvious technology trend. LFP batteries now make up around 90% of deployments, driven by lower cost and better fit for frequent cycling despite being less energy-dense than some EV chemistries. For industrial users, this frequent-cycling strength translates into improved support for daily peak shaving, demand charge management, and backup during voltage dips that can disrupt tight humidity and temperature control in manufacturing.
If you plot these growth regions on a map from the database, you can begin to see geographic clusters around ports, industrial parks, and high-renewable corridors. That spatial perspective is helpful if you’re planning cross-border supply chains, regional production hubs, or shared resources such as centralized compressed-air and dehumidification plants that depend on those same grid conditions.
Policy is often why one country’s storage capacity soars and another’s remains flat, despite having similar renewable resource potentials. When you pull data from a database, tag each project with the policy regime in effect at the time of final investment decision or commissioning. Then correlate capacity trends with those regulatory shifts.
Look for clear interventions that line up with capacity jumps: capital subsidies, feed-in tariffs that reward storage-paired renewables, capacity payments for fast-response storage, or resource-adequacy rules that count batteries. In certain markets, transparent interconnection rules and rapid permitting outperform subsidies because they reduce soft costs and schedule uncertainty for developers.
For industrial consumers, the connection between storage policy and grid reliability is immediate. Where batteries support dependable and cost-effective power in heat waves or polar vortexes, plants experience reduced outages and voltage events that can halt HVAC and humidity control or spoil sensitive batches. As energy storage systems emerge as a fundamental building block for electricity security and renewables integration, notably in markets like Australia and parts of the Middle East, policies that incentivize flexible, responsive assets often accelerate deployment.
In your own database work, construct easy graphics that map policy milestones over country capacity charts. These overlays facilitate better prediction of future grid resiliency and where strong on-site or near-storage is probable, which informs the siting of power-intensive equipment like large industrial dehumidifiers and process climate systems.
Strategic value Global energy storage project databases provide a common perspective on a rapidly evolving market. They extract plant-level data, timelines, costs, and use cases, so teams can plan storage, renewables, and supporting systems with less guesswork and more evidence. For plant managers and engineers, that translates into smarter decisions about where to locate new process loads, how to align storage with demand, and how to maintain tight power quality for sensitive lines and advanced climate control.
Historic and live project records help you visualize where storage truly is headed, not just where the marketing slides say it is. With databases tracking technologies, chemistries, rated power, energy in megawatt hours, duty cycles and revenue streams, you can trace how the industry transitioned from virtually all pumped-storage hydropower to explosive expansion in batteries. Today, pumped storage still leads at roughly 160 gigawatts globally, with the largest national fleet in the US. Batteries are scaling quickly as sub-hourly, hourly and daily balancing tools.
Trend tools matter because the Net Zero Scenario assumes a massive ramp. Grid-scale battery capacity needs to grow 35 times between 2022 and 2030 to around 970 GW, with annual additions around 120 GW a year between 2023 and 2030. A good database allows you to segment those forecasts by country, build rule, or application, and align them with your own growth plans, new production lines, or increased dehumidification demands.
Teams can extract leading indicators directly from the data. Such as time from permit to commissioning, average project size by region, shift from daily balancing only to more flexible, multi-service plants, and share of co-located wind or solar. Given that most plants in service still concentrate on daily balancing, that flag marks where short-duration, fast-cycling assets are likely to be underbuilt today and where the risk of grid volatility is likely to strike industrial users first.
Exporting database fields into simple forecast models or charts gives leadership a common view in strategy meetings. Engineers can construct supply-curve plots, duration stacks, or regional capacity maps and tie them to site-level questions such as backup time for a cleanroom or paint line and the margin required to keep Yakeclimate dehumidifiers and air systems in spec during grid events.
Project-level information cuts through the hype and allows one to rate sites and partners. By analyzing storage type, capacity factor, round-trip efficiency, failures, and revenue stability, you can discover low-risk, high-potential projects that sit on proven grid nodes with established use cases such as peak shaving, firming of on-site solar, or backup for critical climate-controlled spaces.
Benchmarking across the database decreases risk for both plant upgrades and behind-the-meter storage associated with humidity management. You can verify whether suggested costs per kW or kWh align with similar systems, if life cycles under your duty profile are reasonable to expect, and how frequently like assets encounter derating thresholds in warm or moist environments. That simplifies sizing buffers that keep dehumidifiers, chillers, and control gear running during grid swings.
Transparent, third‑party data provides reassurance to institutional investors and lenders. When they note that global battery storage investment already topped USD 20 billion in 2022, with over 65% going to grid‑scale plants, and that databases monitor actual performance over time, they trust cash‑flow models linked to industrial loads and energy‑efficiency improvements more.
Risk frameworks can use direct database metrics: technology maturity, vendor fleet size, policy stability, curtailment history, and response during stress events. Teams can score sites and then link those scores to phased deployment plans, backup strategies for critical lines, and staged rollout of Yakeclimate systems that depend on solid, low-voltage-dip power.
Policy teams and industry groups employ storage databases to identify areas where the grid can actually support additional variable renewables and where it is lacking. Storage is key to hour-to-hour swings in wind and solar PV and becomes more important as their share increases under the Net Zero Scenario. Policymakers need robust project data to determine tariffs, incentives, and flexibility regulations that maintain industrial consumption.
Information about where projects cluster and where queues stall and where storage backs large industrial zones aids in formulating policy based on data. If one region has strong coupling of batteries with factories and tight power-quality metrics, while another has frequent dips that strike climate and air systems, that contrast highlights holes in regulation or grid planning. Policy drafts can refer to real-world megawatts and megawatt-hours in service, rather than just goals and targets.
Following entries over time in these databases demonstrates how rules play out. Shifts in lead times, cancellation rates, state-of-charge utilization, or revenue splits between frequency control versus energy shifting all capture how operators and investors adapt to new policies. This feedback loop is great for industries that rely on consistent power for exact humidity, like pharma and electronics.
Periodic policy reviews that extract fresh statistics from worldwide repositories can calibrate storage expansion to industry demand. That includes better support for combined solutions: on-site storage, high-efficiency drives, and optimized dehumidification that trims peak demand without risking product or process quality.
The upcoming generation of global energy storage project databases won’t be as much about static project lists as about real-time operational intelligence. It will alter plant teams’ planning of power use, backup systems and climate control loads in energy‑intensive sites.
Future databases will ingest live data from storage assets through standard APIs and twins. They will meld power output, state of charge, round-trip efficiency, and cycle counts with grid conditions and weather feeds. That kind of live view will matter as storage capacity scales from today’s baseline to hundreds of times its current size in coming decades. For an industrial site, it means you can connect plant demand profiles, dehumidifier loads, and time-of-use tariffs to real storage behavior instead of last year’s averages.
Coverage will expand well beyond lithium-ion projects in some top regions. New datasets will monitor pumped-storage hydropower, which currently delivers approximately 160 GW and approximately 8,500 GWh, over 90% of current global electricity storage. They will trail flow batteries that can operate 25 to 30 years with near zero degradation and can scale energy capacity with a relatively minimal additional cost. They will map the markets in China, the US, India, and the EU in detail and will also include quick-moving parts of Latin America, Africa, and Southeast Asia where new manufacturing hubs and data centers are emerging.
Open data and shared platforms will have a greater role. Public databases will track where some 170 GW of new capacity in 2030 actually gets built, up from 11 GW in 2022, and whether additions really stay close to 120 GW a year through 2030 to remain on a Net Zero path. They will demonstrate how storage reduces hour-to-hour variability in wind and solar production and how that reduces the need for surge-producing backup fossil plants that cause both grid strain and humidity-induced cooling spikes. As levelized storage costs drop with improved designs and smarter battery mineral use, transparent, convenient data will assist industrial customers in contrasting alternatives and building efficient, low-carbon power and humidity management schemes with allies like Yakeclimate.
Global energy storage project databases provide a clear glimpse into a rapidly evolving field. They follow real locations, real resources, and real cash on the floor. Plant teams utilize them to plan upgrades. Grid planners use them to test supply gaps. Investors use them to size risk and gain share.
Gaps still lie in the data. Small sites fall away. Certain markets are behind. New chemistries move faster than our tables. Trend lines remain obvious. More storage comes online every year. More value stacks on every project.
To map out your next play, corral your own plant data with at least one global database. See what aligns, what misaligns, and where that misalignment indicates your next frontier.
About global energy storage project databases. It follows technologies, geographies, capacities, timelines, and owners. These data sets facilitate market comparison, track trends, and inform policy, investment, and development decisions.
Energy storage databases are being used by developers, investors, policymakers, utilities, and researchers. They use this data to size markets, understand risks, benchmark competitors, and craft policies. Reliable, open data enhances planning, investment, and long-term energy agendas.
Our main gaps are incomplete project lists, missing small projects, outdated status updates, and limited cost and performance data. Most databases underreport behind-the-meter projects and pilots. These blind spots skew market size and country comparisons.
Databases normalize project data by power (MW) and energy (MWh). This enables apples-to-apples comparisons between countries and technologies. Users can view installed capacity, pipeline projects, and growth rates. They can then connect those figures to policies, grid demands, and investment patterns.
They provide certainty to investors, planners, and governments. Trusted data enables better siting, smarter grid planning, and more targeted incentives. Having a good view into the project pipeline illuminates the supply-chain requirements and allows countries to position themselves in the global energy transition.
Quality by provider. The best databases leverage a mix of public sources, regulatory filings, direct project surveys and ongoing updates. Users should review methodology, update frequency, and coverage. Cross checking multiple sources increases confidence in capacity, technology and status data.
Going forward, databases will probably incorporate real-time performance information, additional behind-the-meter systems, and normalized metadata. Anticipate improved coverage of new markets and chemistries and tighter integrations between project data, policy tracking, and grid modeling tools to enable more in-depth and rapid analysis.


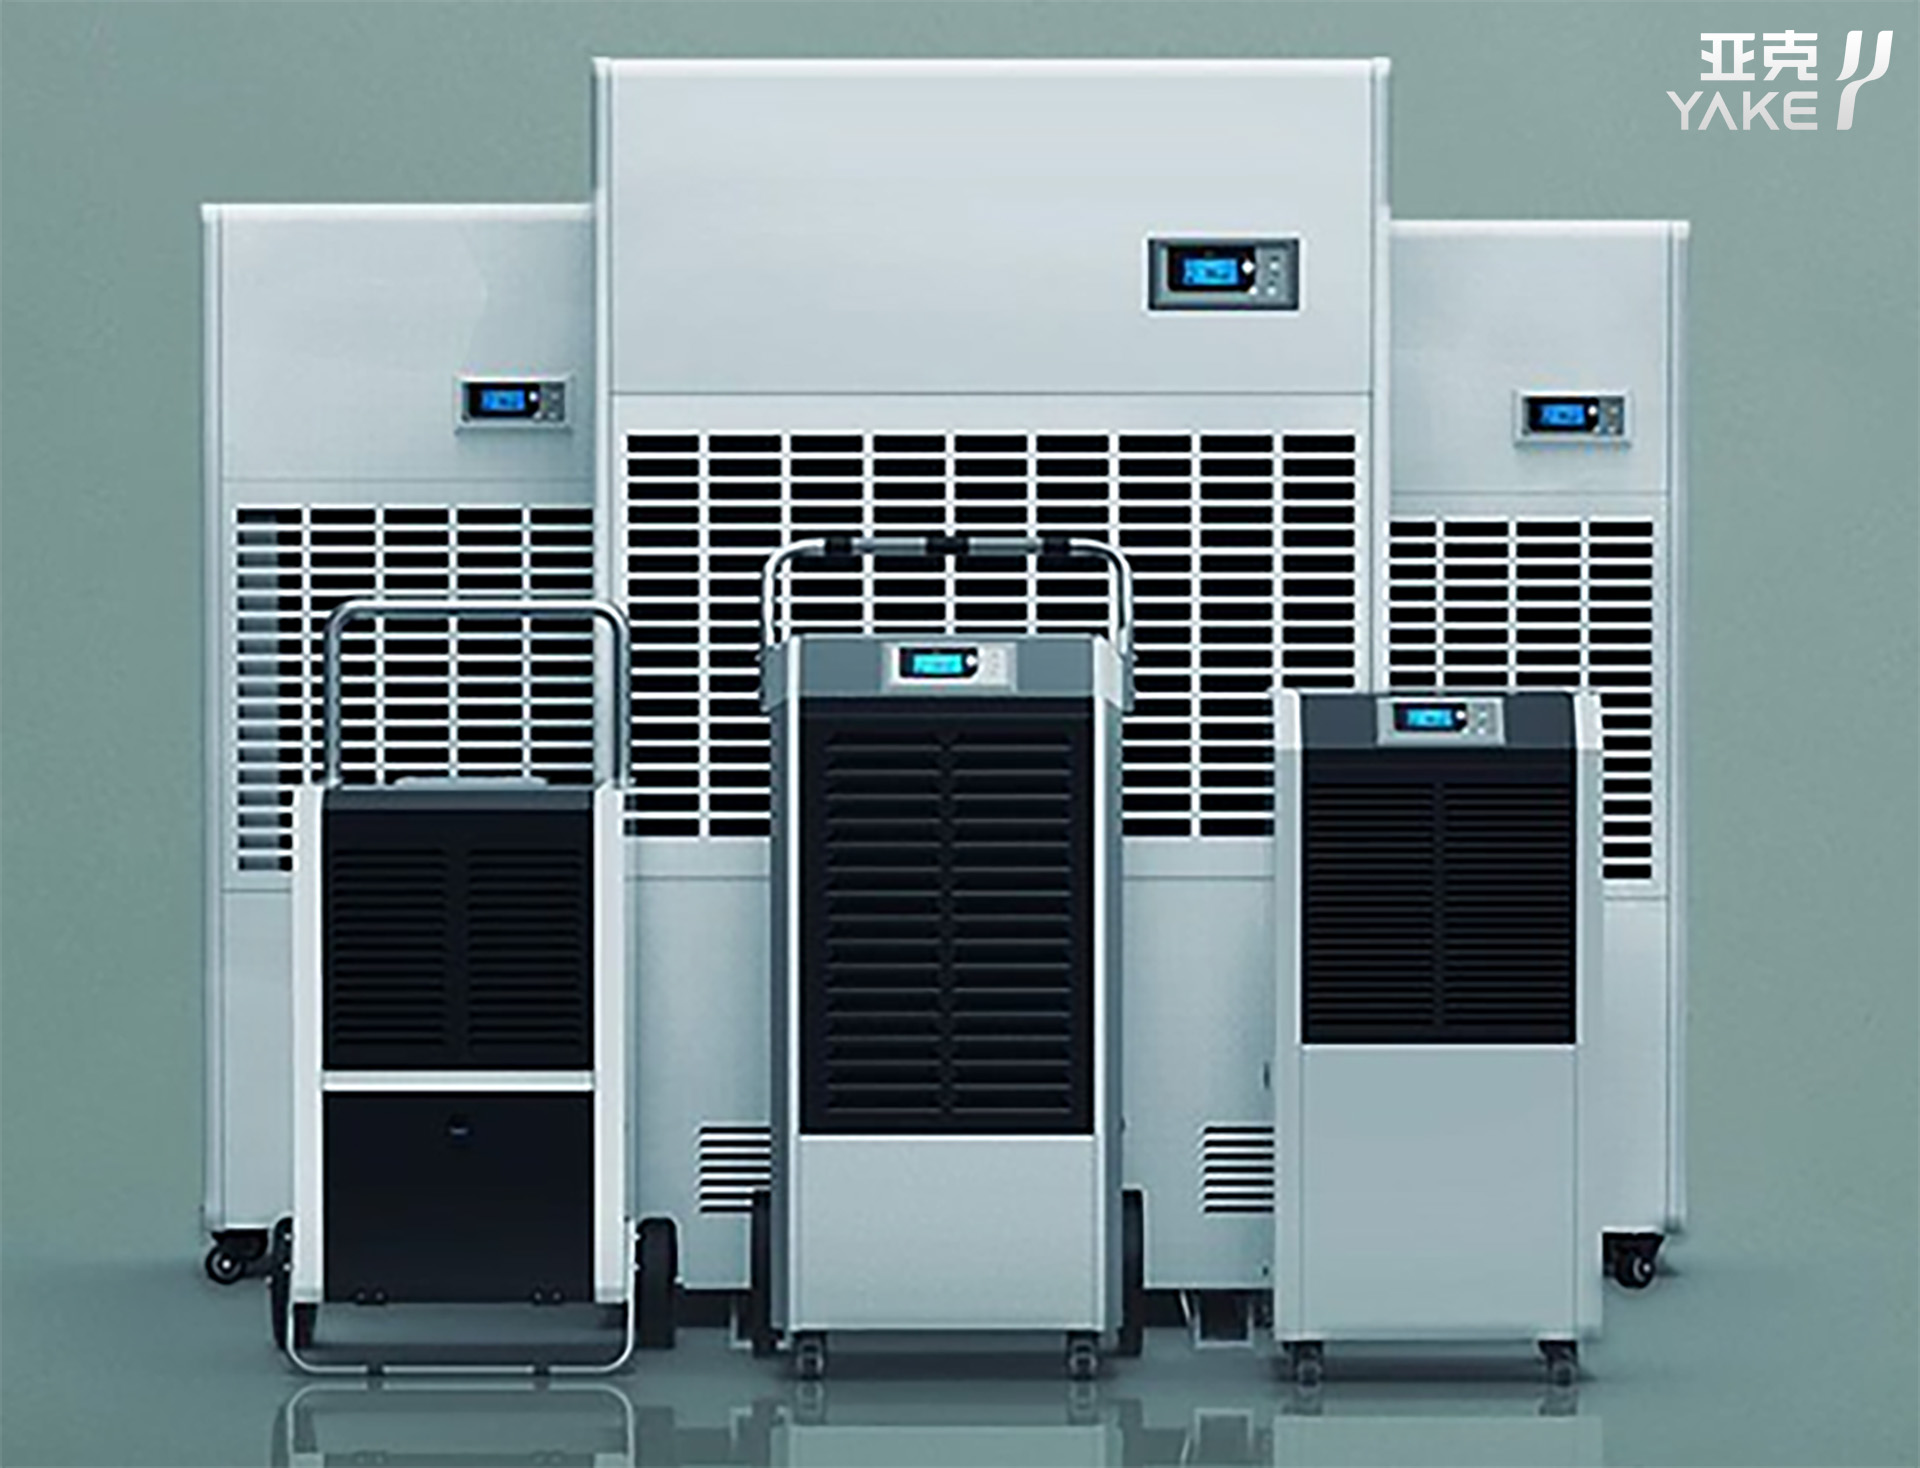
Contact us to find the best place to buy your Yakeclimate solution today!
Our experts have proven solutions to keep your humidity levels in check while keeping your energy costs low.