
Building 34, No. 535 Shunfeng Road, Hangzhou, Zhejiang, China
[email protected]
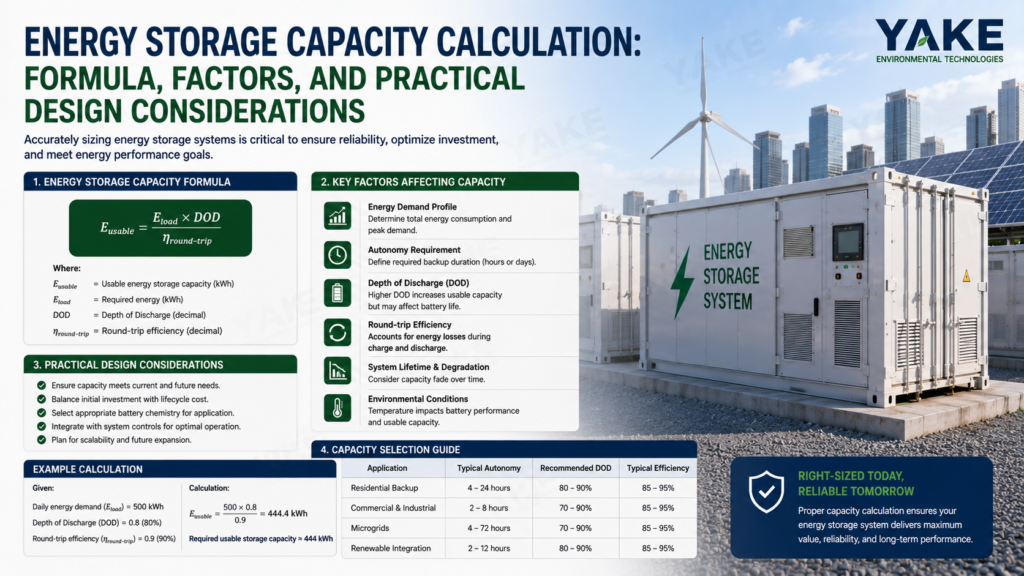

Energy storage capacity formula calculation is the act of determining how much energy a battery, thermal storage tank, or other such system can store through transparent math calculations. Think in terms of crude units such as kilowatt-hours for electric systems and kilojoules or megajoules for thermal systems. In actual plants, the engineers connect capacity to voltage, current, and time, or to mass, specific heat, and temperature change. Little slip-ups in units or input data result in huge discrepancies between design values and field performance. For large load sites, proper capacity math aids peak shaving, backup planning, and load shift efforts. The following sections explain important formulas, unit checks, and easy examples for quick application in everyday work.
Energy storage capacity is how much energy a system can securely store and then release to a load. It specifies how long you can run fans, pumps, control panels, or dehumidifiers before recharge. The key connection is that energy in watt-hours equals power in watts multiplied by hours. For batteries, plant teams usually work with the practical form: watt-hours equals voltage multiplied by amp-hours. Units must stay consistent: volts in V, current in A, time in hours, energy in watt-hours or kilowatt-hours, where one kilowatt-hour equals one thousand watt-hours.
Example comparison for the same 100 Ah rating:
| Device type | Voltage (V) | Capacity (Ah) | Energy (Wh) |
|---|---|---|---|
| Lead-acid battery | 12 | 100 | 1,200 |
| Lithium-ion pack | 24 | 100 | 2,400 |
| Industrial battery string | 48 | 100 | 4,800 |
Regular units provide a neat foundation to incorporate depth of discharge (DoD), system losses (80 to 90 percent efficiency is typical), and safety buffers.
Voltage is the potential difference in an electrical field. It’s the ‘pressure’ that drives current through drives, heaters or dehumidifier compressors. At the same amp-hour rating, a higher nominal voltage holds more energy, as watt-hours equals voltage times amp-hours. A 48 V bank with 200 Ah contains four times the energy of its 12 V with 200 Ah counterpart, and that’s before you account for depth of discharge.
Always use the nominal voltage stamped on the nameplate for capacity math, not peak or float. Voltage must align with the application’s design window and safety protocols, whether that is a 24 V control system or 400 V DC bus, so insulation, breakers, and protection remain within rating.
Amp-hours (Ah) refer to electric charge over a period of time. One amp-hour suggests a battery can theoretically supply one amp for one hour or two amps for half an hour. In actual systems, this varies with temperature, discharge rate, and age, so manufacturer specs are the baseline, not a rule of thumb.
Ah capacity directly affects runtime. A 200 ah, 48 v bank powering a 1,000 watt critical load has a raw capacity of 9.6 kWh, which is calculated by multiplying 48 by 200. With an 80% DoD and 85% system efficiency, you’re left with approximately 6.5 kWh of usable energy, which is the only thing that really matters when planning your plant.
Watt-hours are the amount of energy provided over the course of an hour at the specified power draw. This is the unit that ties battery math to actual field usage: if a humidity-control system draws 2 kW, then a 10 kWh storage bank can, in theory, support it for about 5 hours before losses and DoD limits. The basic relation is stable: Watt-hours equals voltage multiplied by amp-hours, then convert to kilowatt-hours when values grow large.
Watt-hours allow us to compare various storage technologies on the same scale, whether it’s a 48 V lithium-ion rack, a 400 V industrial string, or a smaller home system. Lithium-ion can operate at greater depth of discharge, sometimes even near 100%, with less impact on life than lead-acid, so 10 kWh of lithium will frequently deliver more usable watt-hours over its lifespan. Temperature shifts this further: high heat speeds discharge and aging, while low temperatures cut effective capacity and slow charging, which is important in warehouses or cold rooms.
For residential or small commercial installations, a reasonably sized battery can capture excess energy in high-production months and serve as backup in low-production months. Sizing often starts from daily use. Required capacity in kilowatt-hours equals daily load in kilowatt-hours divided by depth of discharge multiplied by autonomy days. If daily use is 10 kilowatt-hours, depth of discharge is 0.8, and autonomy is 2 days, capacity equals 10 divided by 0.8 multiplied by 2, which equals 6.25 kilowatt-hours. After that, engineers account for 80 to 90 percent system efficiency and then add about 20 percent additional buffer for unanticipated loads or harsher climates.
The core method is straightforward:
Example for an industrial panel backup: a 48 V lithium bank, 150 Ah. Raw energy equals 48 multiplied by 150, which equals 7,200 Wh or 7.2 kWh. With 90 percent round-trip efficiency and 90 percent depth of discharge, usable energy equals 7.2 multiplied by 0.9 multiplied by 0.9, which is approximately 5.8 kWh. Add a 20 percent buffer for spikes and aging, resulting in a target of approximately 7.0 kWh installed. Engineers then construct a tiny matrix of candidate cells or strings, cross-reference watt-hours, cost per kilowatt-hour, area, and lifetime, and select the group that satisfies both energy and safety constraints. Ensuring everything is in the same units and with the same depth of discharge and efficiency assumptions double-checks any common sizing errors.
At the basic level, energy storage capacity uses a formula such as energy equals power (kW) times time (h) or in batteries nominal voltage times ampere-hours. In real plants, this is just the beginning. Usable capacity changes with efficiency, temperature, and degradation. Those changes are big enough to throw off production, backup time, and HVAC balance if you neglect them. If you build for any system that supports humidity control, critical process loads, or safety equipment, you must have capacity that matches real operating conditions, not lab numbers.
Every conversion stage wastes some energy. Batteries radiate energy as heat through internal resistance during charge and discharge. Power electronics contribute additional loss. Contemporary inverters operate at approximately 90 to 98 percent efficiency, meaning that for every 100 kWh that reaches the DC bus, 2 to 10 kWh dissipate as heat within the inverter itself, thereby increasing the cooling demand in your electrical room or dehumidifier skid.
To fix the basic formula, apply a general round-trip efficiency rate to the nameplate capacity. In industrial battery systems, this is typically 80 to 95 percent once you factor in battery electrochemistry, cabling, inverter, and auxiliary loads such as controls and cooling fans. A 1 MWh nominal pack with 85 percent round-trip efficiency will deliver approximately 0.85 MWh usable per full cycle, and less still if you restrict depth of discharge.
Less efficient not only wastes energy to produce. It slices viable backup time and independence. If you’re sizing storage to keep air handlers, dehumidifiers, and process fans running through an outage, use real loss factors. Underestimating system losses is an all-too-common cause of shortfall, where a design that appeared reasonable on paper yields only 60 to 70 percent of the desired runtime in the field.
Thinking with these losses in mind sets the operator’s right expectation and prevents overselling performance to management or regulators. It’s wiser to size for actual usable energy than to pursue optimal numbers that no real system can achieve at scale.
Temperature swings have a direct effect on how much energy a storage system can deliver and how fast you can move that energy in or out. Cold conditions slow down the internal chemical reactions in batteries, which shrinks apparent capacity and raises internal resistance. At −10 °C, some lithium-ion chemistries can show 20 to 30 percent less available capacity compared to 25 °C, and charge rates often must be capped to prevent plating and long-term damage.
High temperatures exert capacity in the opposite direction in the short term, they increase risk. At 35–40 °C, the majority of chemistries experience accelerated degradation, gas generation and increased risk of failure. Discharge can feel robust for a time, but cycle life plummets. In cramped equipment spaces, inverter and cable losses contribute additional heat, which means temperature management is part of energy strategy, not merely comfort.
For any climate-controlled system, temperature thresholds and battery life are connected. If the room is too cold, batteries won’t power peak loads for humidifiers and fans. If it drifts too hot, you’re exchanging current capability for less service life and additional upkeep. We can all agree that beyond our basic calculation, manufacturer data sheets usually specify an optimal window, often around 20 to 25 °C, where capacity, safety, and life are balanced.
When calculating effective capacity, correct for your site’s anticipated temperature band, not the test bench. In brutal climates or unconditioned spaces, it can be worth adding some simple thermal management, such as insulation, basic HVAC, or improved airflow, so your energy storage and humidity-control hardware both sit at their optimal operating temperatures.
All energy storage degrades over time, regardless of the quality of the cell chemistry or controlling software. Each charge-discharge cycle reduces capacity and calendar aging adds more, even while resting. That’s why a 1 MWh system might provide just 0.8 MWh after years of daily cycling, though it still passes safety checks.
Cycle life and degradation rate should flow directly into long-term planning. Lithium-ion packs typically provide more than 4,000 cycles at moderate depth of discharge, whereas lead-acid units hover around 500 to 600 cycles for comparable duty. Depth of discharge (DoD) is one of the main levers. Lithium-ion can usually handle around 80% DoD, but many lead-acid designs are kept nearer 50% DoD to stay within acceptable life.
You can factor this into your capacity calculus with a straightforward percentage degradation per year or per 1,000 cycles. For example, assuming a 2% loss per year under your duty cycle, a 1 MWh system could be modeled as 0.9 MWh usable after five years, prior to efficiency and temperature corrections. Then combine that with your autonomy and backup requirements. If you need 300 kWh per day to keep key HVAC, dehumidifiers, and control systems stable and you design for two days of autonomy at 80% depth of discharge, your starting nominal capacity will be higher than 600 kWh so that even with degradation, you still meet those targets in year seven or eight.
Periodic checking is the final step that connects the arithmetic to reality. Monitor energy delivered per cycle relative to the initial baseline and record temperature, DoD, and inverter efficiency. With that information, you can watch when operating capacity dips below your humidity control or process stability requirements and plan augmentation or replacement before it manifests as downtime.
Chemistry lurks underneath each of those energy storage capacity equations. It determines the actual confines of how much energy you can store, how long the system runs, and how safe and adaptable it is to operate in a plant.
The active materials and electrolyte determine specific energy in watt-hours per kilogram and energy density in watt-hours per liter. Lithium-ion cells commonly approach 150 to 250 watt-hours per kilogram and 250 to 700 watt-hours per liter, whereas typical lead-acid ranges closer to 30 to 50 watt-hours per kilogram and 60 to 110 watt-hours per liter. Zinc-air can get to about 400 watt-hours per kilogram, but it has less power density and different operating constraints. These gaps drive spatial needs. A compact lithium-ion rack might use 0.01 to 0.03 square meters per kilowatt-hour, while an equivalent lead-acid bank can need far more floor area and support steel. For a tight cleanroom or paint line, that space penalty may be a direct layout constraint.
Chemistry determines cycle life and DoD. LiFePO₄ can run at 80–90% DoD with long life, while lead-acid is typically kept around 50% DoD to prevent premature failure. Even if the nameplate capacity is the same, the useful energy capacity over the duty cycle differs. When you size from a capacity formula, you have to plug in usable energy, not nominal kWh, or you under or overshoot cabinet count, HVAC load and upstream switchgear.
Self‑discharge and power density come from chemistry. Other nickel systems discharge rapidly and don’t match well with extended-standby backup. Zinc‑air offers superior specific energy but has a power density of only about 50–100 kW/m³, therefore fitting steady rather than sharp-peak discharge. The theoretical cell potential, determined by chemistry, limits efficiency and how many cells you must string in series for a certain DC bus.
For quick comparison, rough typical values:
Mechanical storage provides massive, decades-living buffers for plants that value both uptime and energy consumption. It doesn’t supplant batteries everywhere, but it provides powerful alternatives in situations where space, civil works, and grid ties are considered.
Mechanical storage categories such as flywheels and pumped hydro occupy the center. Flywheels store kinetic energy in a high-speed rotor. The base formula comes from kinetic energy: Energy equals one-half times mass times velocity squared, where energy is in joules, mass is rotor mass in kilograms, and velocity is rim speed in meters per second. In actual design, velocity relates to angular velocity via velocity equals angular velocity times radius, and energy is expressed as energy equals one-half times moment of inertia times angular velocity squared, with moment of inertia being the moment of inertia. High-speed composite flywheels drive angular velocity high, so they achieve practical power with small mass. This suits short jobs such as paint lines or cleanroom drives ride-through, with discharge times ranging from roughly 15 seconds to 15 minutes. That’s plenty to ride out a sag, maintain climate control, and keep dehumidifiers and air handlers steady as backup generators ramp up.
Pumped hydro storage (PHS) uses gravitational potential energy. Energy equals mass multiplied by gravity multiplied by height, where mass is water mass, gravity is approximately 9.81 meters per second squared, and height is the effective height difference or dynamic head. For a plant or region, capacity depends on dynamic head, flow rate at times, pump or turbine efficiency, and hours operated. Round‑trip design considers how many pumps or turbines are online in each time step t.
Np,t equals Esurplus,t divided by Ep,t. NT,t equals Edeficit,t divided by ET,t. In this equation, Esurplus,t represents surplus energy in that interval, Edeficit,t is the gap that must be supplied, and Ep,t and ET,t are the per-unit pump and turbine energy during that interval. Well-sited PHS plants can reach 100 to 5000 MWh, but they require large surface areas, commonly ranging from 200,000 to 5,000,000 m², so they exist at the grid or regional scale, not on a single factory roof.
For planning, it helps to compare mechanical and electrochemical storage in one view:
| Aspect | Mechanical (Flywheel, PHS) | Electrochemical (Lead‑acid, Li‑ion) |
|---|---|---|
| Main storage form | Kinetic / gravitational | Chemical |
| Typical capacity range | kWh (flywheel) to 100–5000 MWh (PHS) | Wh to MWh (modular battery banks) |
| Energy density | Low–medium (site‑level) | Up to ~382.4 Wh/kg (Li‑ion) |
Round-trip efficiency Medium–high (site-specific) is approximately 75–80 percent for lead-acid batteries and is higher for Li-ion. Space requirement is high for pumped hydro storage; it is compact for flywheels. There is high energy in a small footprint. The duty profile includes quick response, extended life, and numerous cycles. It is versatile, though it is subject to aging and cycle limitations. Operating temperature is broad, with some solid electrolyte systems near 1000 degrees Celsius. Typically, it is close to ambient with thermal management.
For a humidity-critical plant that tracks the energy and the risk, the magic mix is often fast flywheels or batteries paired with consistent, efficient bulk storage and stable HVAC and dehumidification loads.
What grid-scale energy storage does is move ‘capacity’ from being just a kWh number to a system-level design parameter. The figures are immense. One grid battery can be 100 MW with 400 MWh usable energy, able to run full power for four hours. National grids may be planning gigawatt-hours of storage to ride through long ramps in solar and wind output. For a plant engineer accustomed to sizing UPS systems or local backup, this is a huge leap in scale and risk.
Capacity calculation at this level has to connect power, energy, and time with real losses. A simple equation such as energy supplied to the grid in megawatt-hours equals installed energy in megawatt-hours multiplied by depth of discharge multiplied by round-trip efficiency won’t do by itself. You have to account for inverter efficiency, which typically ranges from 90 to 98 percent, battery degradation curves, temperature effects, and grid dispatch patterns. If you overshoot capacity, you lock in stranded capital. If you undershoot, you risk grid instability and failing regulatory review. System operators want transparent models that demonstrate how the storage asset contributes to frequency control, peak shaving, and reserve margins throughout its life.
The role of grid-scale storage is simple to state and hard to do well: capture energy when it is cheap or surplus and release it when it is scarce. That includes smoothing quick solar ramps, backing up wind lulls, and reducing curtailment. Still, studies such as those done in South Australia show that well-sited grid batteries can cut emissions by load-shifting gas peakers. To capture that advantage in the real world, engineers have to scale both duration in megawatt-hours and power in megawatts to actual load and generation data, not just nameplate renewable capacity.
No one technology is dominant for all use cases. Lithium-ion is commonplace, with approximately 10 to 15 years in grid service. NaS and other chemistries add longer duration or better high-temperature behavior. Many grids layer them: fast lithium-ion for frequency response, plus longer-duration storage for daily shifting, backed by pumped hydro or thermal storage. Every layer requires its own capacity model and loss profile, and they all have to fit with grid codes and SCADA control logic.
Energy storage capacity looks simple on paper. Capacity equals power times hours, maybe divided by an efficiency term. In real plants and big commercial sites, those fast formulas fail fast and provide a misleading sense of safety.
Simple formulas overlook how load actually acts. Daily energy use does not remain flat at a convenient kWh number. It swings with weather, shift patterns, batch cycles, weekend shutdowns, and even maintenance. A plant averaging 5,000 kWh per day might pull 3,000 kWh on mild days and 7,000 kWh on hot, humid production days with a heavy HVAC and dehumidification load. Design for the mean and you underestimate storage for the moments that count.
They bypass battery limits. You can’t use 100% of the nameplate capacity. Depth of discharge is a very significant factor in determining life and reliability. A pack sized “just right” on paper at 80% depth of discharge may lose useful capacity rapidly, while a design that plans around 50% depth of discharge will typically last significantly longer and reduce unexpected downtime. For critical humidity control or cleanrooms, that trade-off is not optional.
Simple equations either treat efficiency as a single number or ignore it. In practice, you stack losses: inverter efficiency of 90 to 98 percent, DC cabling, thermal losses, and auxiliary loads like controls, pumps, or fans. Something that appears okay at 95 percent round-trip can end up more like 85 to 90 percent once you follow every path.
Duration is another blindspot. An hour of storage helps smooth short spikes or supports frequency regulation. It may require four or more hours for peak shaving, valley filling, or to get through late-afternoon solar drops. The same kWh installed with the wrong duration profile will fail to satisfy the use case.
On the grid side, interactions become even more intricate. Four-hour ELCC drops faster in hot regions with long peak load hours than in cooler regions like parts of the Pacific Northwest. Solar and wind add additional layers. Increasing solar penetration can render net load more “peaky,” which typically raises shorter-duration storage’s ELCC, but at extremely high storage penetration, four-hour and ten-hour systems both experience ELCC decline to low levels. That capacity-reliability link is not linear, and simple kWh sizing will not capture that.
Location counts. Local demand shapes grid rules and climate all impact what the “same” system can provide. A storage system designed for a food plant in a dry, mild area is going to perform quite differently in a humid coastal area with high dehumidification and cooling load.
The way out is to fold all this into the sizing workflow: model variable loads, apply realistic DoD limits, include all loss terms, match duration to use case, and use grid and renewable data instead of static assumptions. Then continue testing the live system, fine-tuning setpoints, safety margins, and control logic until actual performance matches what the plant relies upon.
Energy storage math appears nice and clean on paper, but real projects almost never maintain that tidiness. One formula, like E equals P times t, provides a quick reality check. It’s not the whole story. Chemistry, DOD, round trip loss, and real load shapes all modify the useful capacity.
On a shop floor, in a data hall, or on a grid site — the same rule applies. Begin with the proper formula and then run it through heat, component wear and control logic. A lithium pack, a flywheel skid, and pumped hydro plant all store joules, but each behaves very differently.
For your next system spec or upgrade, bring these formulas to the table and apply them with real numbers from your site.
Energy storage capacity is usually calculated with: Energy (Wh) equals Voltage (V) times Capacity (Ah). For kilowatt-hours, use: Energy (kWh) equals Voltage (V) times Capacity (Ah) divided by 1,000. This works well for batteries in equilibrium.
To express battery energy in joules, one kilowatt-hour (kWh) equals 3.6 multiplied by 10 to the power of six joules (J). First, get energy in kWh. Then, multiply by 3.6 multiplied by 10 to the power of six to convert kWh to J.
Easy formulas ignore variable voltage and idealize. In real systems, voltage varies with load, temperature, aging, and chemistry. Converter, cable, and control losses diminish usable energy.
Different chemistries have different nominal voltages and usable depth of discharge. For instance, lithium-ion generally supports a deeper discharge than lead-acid. This is why two batteries with the same Ah rating can store different usable energy.
For a flywheel, stored kinetic energy is: Energy equals one-half multiplied by moment of inertia multiplied by angular speed squared, where I is the moment of inertia (kg·m²) and ω is angular speed (rad/s). Higher velocity and greater inertia translate to more stored energy.
Grid-scale capacity needs to factor in round-trip efficiency, charge/discharge restrictions, and losses within the system. Engineers think in terms of usable MWh, not theoretical. They consider grid requirements, like peak shaving and backup length.
Depth of discharge (DoD) is the proportion of the energy you actually draw. Usable energy is determined by multiplying total energy by DoD. Restricting your DoD is great for longevity, but it cuts the capacity available to you per cycle.


Contact us to find the best place to buy your Yakeclimate solution today!
Our experts have proven solutions to keep your humidity levels in check while keeping your energy costs low.